How to trade swings in the gold market
With the gold market so heavily long, there is money to be made by trading against the main trend. John C Burford demonstrates how with a recent trade.
Get the latest financial news, insights and expert analysis from our award-winning MoneyWeek team, to help you understand what really matters when it comes to your finances.
You are now subscribed
Your newsletter sign-up was successful
Want to add more newsletters?

Twice daily
MoneyWeek
Get the latest financial news, insights and expert analysis from our award-winning MoneyWeek team, to help you understand what really matters when it comes to your finances.

Four times a week
Look After My Bills
Sign up to our free money-saving newsletter, filled with the latest news and expert advice to help you find the best tips and deals for managing your bills. Start saving today!
There's no doubt about it; the gold market is capturing the attention of just about every investor out there - with articles appearing even in the popular financial press. And no wonder. As faith in the value of fiat currencies (that is, all of them) has declined in the last few years, gold's traditional role as the ultimate store of value has come to the fore (once again).
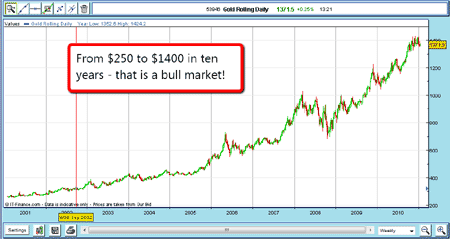
Of course, this degree of promotion has kept the bull market alive for many years. Here is the chart going back ten years showing the progress from $250 an ounce to the recent $1,400 level. Note there have been dips along the way (the most severe being the $350 drop in 2008). But the chart shows clearly the accelerating rise for the past two years.

(Click on the chart for a larger version)
MoneyWeek
Subscribe to MoneyWeek today and get your first six magazine issues absolutely FREE

Sign up to Money Morning
Don't miss the latest investment and personal finances news, market analysis, plus money-saving tips with our free twice-daily newsletter
Don't miss the latest investment and personal finances news, market analysis, plus money-saving tips with our free twice-daily newsletter
But it is only in the last two years or so that gold has been making headlines so relentlessly.
The forceful message has been to buy gold for asset protection. And more and more people are doing just that resulting in the exponential rise.
Now, I am not a long-term investor, and so such considerations only play a background role as an indicator of market sentiment. As I have emphasised, my style of trading is mostly geared towards attempts at catching the counter-trend moves in an ongoing larger trend.
In gold, the market is heavily long in other words, most small investors/traders and professionals are bullish, while the trade is mostly bearish (or at least hedged, which is the same thing). The gold market is getting more and more vulnerable to downswings, if only because the 'weak' hands are long, and the 'strong' hands are short.
In a previous post, I described a recent trade that made money on a significant drop in the gold market. I pinpointed a spot where the technical indicators had told me to expect such a fall, and then covered my short trade near the bottom of that move.
In the gold market, there are many who look to buy on these dips many articles in the press advise doing just that.
And I'm about to join them!
I go long gold
Following my latest short trade, which was closed on 5 January, I stood aside and just watched market action. Since the move down from the 3 January high was in a classic five-wave Elliott wave pattern, I expected a decent rebound at least.
As it happened, the market did rally to the 50% Fibonacci retrace around $1,390. I applied my Fibonacci tool to the $1,424 high on January 3 and to the January 7 low at $1,352 to find this level. But the rebound was very choppy and indicated to me that another drop was on the cards.
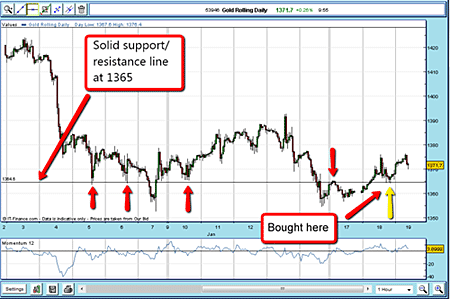
We got that decline on January 13 and 14, and the market came down to challenge the $1,352 low on January 14. But then I discovered that I can draw a horizontal solid support/resistance line at the $1,365 level, and it touched several turning points on the hourly chart, including the recent January 17 high.

(Click on the chart for a larger version)
When the market rallied up through the line the next day (January 18), I wondered if this line would now be support on declines. I then decided to try for a long trade if the market dipped back to my line (see the yellow arrow).
I could set my stop quite close, as another break below the line might well mean the market was headed a lot lower. My stop was then set at $1,362. This is well within my3% rule.
The market did come back and touch my line and I was filled.
18 Jan long £3 rolling gold @ $1,365.00
Stop @ $1,362.00
Risk 30 pips (£90 on £6,000 account)
Finding the right place to take profits
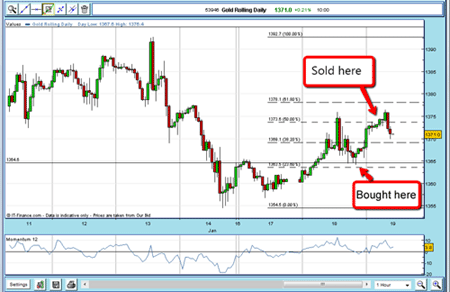
My other question was: if successful, where to take my quick profits? I applied my Fibonacci tool to the latest wave, using the January 13 $1,392 high and the January 14 $1,354 low as my pivot points.

(Click on the chart for a larger version)
Since the 50% retrace level is a common turning-point for wave retracements, I set my exit sell orders at this level ($1,375.50).
19 Jan sold £3 rolling gold @ $1375.50
Profit 105 pips = £315 on £90 risk
Although most of my gold trades are from the short side, I am not averse to looking for good trades from the long side.
If you are short-term swing spread-betting, you can seek opportunities on both sides, long or short. Just remember to use sensible money-management techniques, such as my 3% rule, and if you are away from the market for any length of time, my break-even rule.
NB: Don't miss my next bit of trading advice. To receive all my spread betting blog posts by email, as soon as I've written them, just sign up here .
Get the latest financial news, insights and expert analysis from our award-winning MoneyWeek team, to help you understand what really matters when it comes to your finances.
John is is a British-born lapsed PhD physicist, who previously worked for Nasa on the Mars exploration team. He is a former commodity trading advisor with the US Commodities Futures Trading Commission, and worked in a boutique futures house in California in the 1980s.
He was a partner in one of the first futures newsletter advisory services, based in Washington DC, specialising in pork bellies and currencies. John is primarily a chart-reading trader, having cut his trading teeth in the days before PCs.
As well as his work in the financial world, he has launched, run and sold several 'real' businesses producing 'real' products.
-
 Average UK house price reaches £300,000 for first time, Halifax says
While the average house price has topped £300k, regional disparities still remain, Halifax finds.
-
 Barings Emerging Europe trust bounces back from Russia woes
Barings Emerging Europe trust has added the Middle East and Africa to its mandate, delivering a strong recovery, says Max King