Another lesson in money management from the euro
John C Burford illustrates the importance of stop-losses in this 'wash' trade from the currency markets.
Get the latest financial news, insights and expert analysis from our award-winning MoneyWeek team, to help you understand what really matters when it comes to your finances.
You are now subscribed
Your newsletter sign-up was successful
Want to add more newsletters?

Twice daily
MoneyWeek
Get the latest financial news, insights and expert analysis from our award-winning MoneyWeek team, to help you understand what really matters when it comes to your finances.

Four times a week
Look After My Bills
Sign up to our free money-saving newsletter, filled with the latest news and expert advice to help you find the best tips and deals for managing your bills. Start saving today!
When I last left the euro on Thursday 19 May, it was making a relief rally off the 18 May low at 1.4050 to the US dollar.
Recall that on the long-term chart, this level represents very strong support and resistance. It is the 'line in the sand' at this stage of the market.
A sharp break of this level would almost certainly seal the fate for EUR/USD for months to come and bewilder the huge army of dollar bears who believe the US dollar is a total basket case an even bigger one than the euro, which is bad enough.
MoneyWeek
Subscribe to MoneyWeek today and get your first six magazine issues absolutely FREE

Sign up to Money Morning
Don't miss the latest investment and personal finances news, market analysis, plus money-saving tips with our free twice-daily newsletter
Don't miss the latest investment and personal finances news, market analysis, plus money-saving tips with our free twice-daily newsletter
As you know, I love proving the herd wrong it must be due to my competitive streak. But to profit from this approach, your timing must be immaculate.
And here is a great example of using the Fibonacci tool on your spreadbetting platform to pinpoint precise entries against the trend.
Hunting for turning points
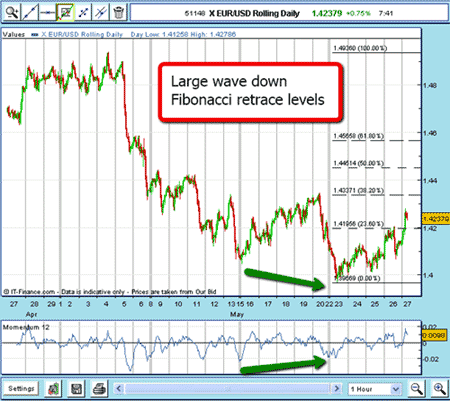
Here is the chart as of today, 27 May:

(Click on the chart for a larger version)
From the 4 May high at 1.4940, the market plunged in five Elliott waves to the 23 May low at just under 1.40, where it met good support (remember the 1.4050 support?).
The final wave down from May 20 put in the fifth wave and on a positive momentum divergence, albeit a small one (marked with green arrows).
And when five waves are complete, what do we get? Generally, a three-wave corrective pattern, and that is what I was waiting for.
My plan was to short EUR/USD when I could see three clear waves up off the 23 May low, and when the market reached a Fibonacci retracement.
Not every trade can be a winner
In fact, this trade was not a winner. Sadly, not all of mine are. However, it was also not a loser! As such, I consider it a terrific trade. Here is what happened:
Going back to the chart above, I have drawn in the Fibonacci levels from the May 4 high to the 23 May low the big wave down. We will refer to them a bit later.
Going back to the week of 23 May, the relief rally was progressing up steadily, and on the morning of 26 May, it thrust into a new high for the move.
A classic A-B-C pattern was in the making!
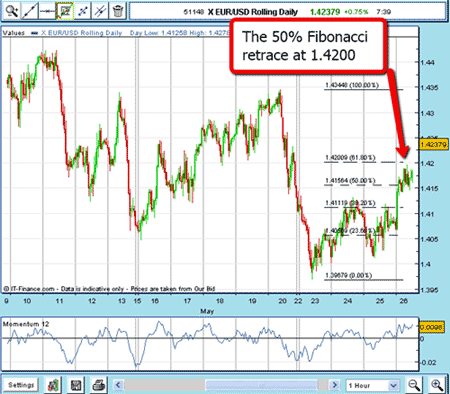
Now I applied my Fibonacci tool to the 20/23 May final wave down from 1.4345 to 1.3970 and what do I see?

(Click on the chart for a larger version)
I see the Fibonacci 50% level was fast approaching. OK, we have a budding A-B-C, an important Fibonacci level, and high momentum. Time to put out a short.

(Click on the chart for a larger version)
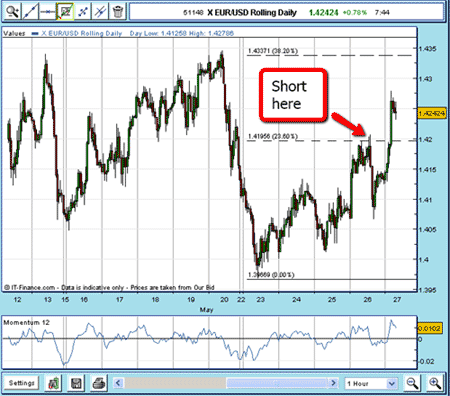
I entered a limit order to sell right at the 1.4200 level, which was hit in the early afternoon of May 26.
Since I believed that if the 50% level was not the final reversing place, and that it would probably carry on to the 1.4250 area at least, I placed a close stop at 1.4230, allowing a 30-pip risk. This was well within my 3% rule.
As it happened, the market did turn around at 1.4200 and moved down towards the 1.4050 line in the sand, as you can see on the chart above.
So far, so good.
The importance of good stop-loss management
But that is when I took no chances and moved my protective stop down to 1.4200 using my break-even rule. I had a good margin of at least 100 pips to work with.
And a very good thing I did, as the market zoomed back up through my stop in the early hours of this morning.
That meant that this trade was a 'wash' neither a profit nor a loss. And that was a terrific trade. I hope you agree.
But what now?
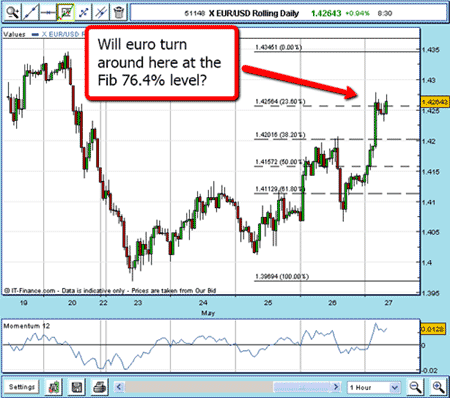
The market has now made it to the next Fibonacci level:

(Click on the chart for a larger version)
Is this a suitable place to try another short?
I'll keep you in suspense and let you know my decision in my next post.
NB: Don't miss my next trading insight. To receive all my spread betting blog posts by email, as soon as I've written them, just sign up here .
Get the latest financial news, insights and expert analysis from our award-winning MoneyWeek team, to help you understand what really matters when it comes to your finances.
John is is a British-born lapsed PhD physicist, who previously worked for Nasa on the Mars exploration team. He is a former commodity trading advisor with the US Commodities Futures Trading Commission, and worked in a boutique futures house in California in the 1980s.
He was a partner in one of the first futures newsletter advisory services, based in Washington DC, specialising in pork bellies and currencies. John is primarily a chart-reading trader, having cut his trading teeth in the days before PCs.
As well as his work in the financial world, he has launched, run and sold several 'real' businesses producing 'real' products.
-
 Average UK house price reaches £300,000 for first time, Halifax says
While the average house price has topped £300k, regional disparities still remain, Halifax finds.
-
 Barings Emerging Europe trust bounces back from Russia woes
Barings Emerging Europe trust has added the Middle East and Africa to its mandate, delivering a strong recovery, says Max King