A blow-by-blow account of my latest FTSE trade
John C Burford continues his live trade in the FTSE 100.
Get the latest financial news, insights and expert analysis from our award-winning MoneyWeek team, to help you understand what really matters when it comes to your finances.
You are now subscribed
Your newsletter sign-up was successful
Want to add more newsletters?

Twice daily
MoneyWeek
Get the latest financial news, insights and expert analysis from our award-winning MoneyWeek team, to help you understand what really matters when it comes to your finances.

Four times a week
Look After My Bills
Sign up to our free money-saving newsletter, filled with the latest news and expert advice to help you find the best tips and deals for managing your bills. Start saving today!
Last time, I left my short FTSE trade open overnight (on Tuesday 12 April) as I expected more work on the downside, but with an intervening rally. Overnight, there was an attempt to rally from very oversold momentum readings.
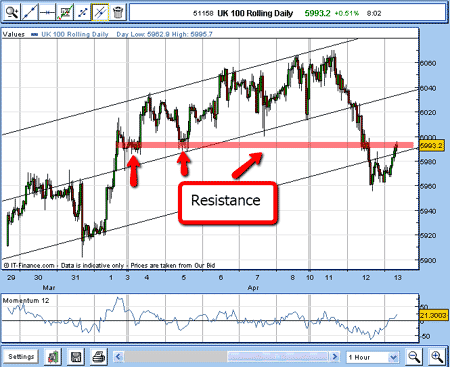
But the rally was encountering resistance as marked by the light red bar on my chart below. Here's how the trade continued, blow-by-blow, from yesterday morning right up to this morning:
Wednesday 13 April, 8:00am: The market has already moved below my lowest tramline, and is attempting to move back above it. But the rally has taken the market to the Fibonacci 38.2% retrace of the move down from Monday's high.
MoneyWeek
Subscribe to MoneyWeek today and get your first six magazine issues absolutely FREE

Sign up to Money Morning
Don't miss the latest investment and personal finances news, market analysis, plus money-saving tips with our free twice-daily newsletter
Don't miss the latest investment and personal finances news, market analysis, plus money-saving tips with our free twice-daily newsletter
If the overhead resistance can be overcome, will the market reach the underside of my central tramline (typical behaviour), and then suffer a 'scalded cat' bounce down? Here is the situation:
(Click on the chart for a larger version)
11:00am: Trade stopped out: The rally has now carried beyond the Fibonacci 50% level and has passed through my break-even stop at 6,015 for a 'wash' trade (ie a trade that breaks even).
I shall observe now how the market develops as it approaches the underside of my central tramline. But momentum is overbought, and so it may not make it. I may look to re-establish a short position, but I'll let the market make its print.
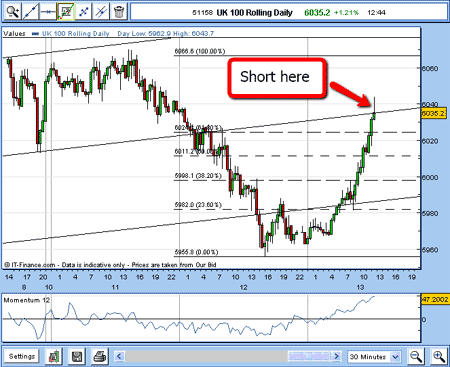
12:00 noon: There's been a sharp rally right to the Fibonacci 61.8% retrace at 6,024 but momentum is way overbought and there is solid overhead resistance still.
12:45pm: OK, now FTSE has made it to my tramline and I have entered a limit sell-stop at 6,040 and I am quickly filled. I'll set my protective stop at 6,060 for a 20 pip risk.
(Click on the chart for a larger version)
New trade placed: Sold FTSE at 6,040. I place my protective stop at 6,060 for a 20 pip risk. Momentum is in the clouds.
Trading in my style involves probing the markets. I do not expect to get my timing spot-on at the first attempt. Sometimes, I need a few trades to get on the right side of the market.
Now, you may ask: why did I move my stop to break-even, get stopped out, then go and short again using a different stop? Why not just keep the original short and just put the stop at the higher 6,060 level?
The answer to that, of course, is that it would have placed me at unacceptable risk (of 45 pips). This was more than I was willing to take. My new position carries an acceptable risk of 20 pips, having made break-even on the first attempt.
That is not to say that other traders would have been unhappy with that 45 pip risk. Different strokes. The key is to always have your exposed risk under control and within your guidelines that is proper money management. As you know, I use my 3% rule.
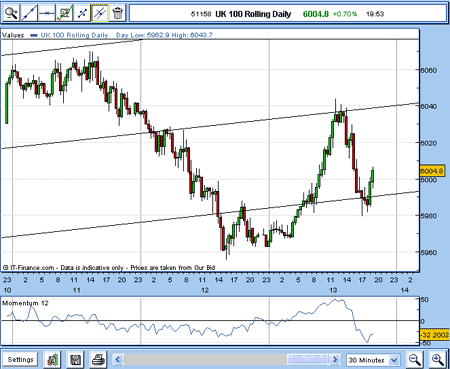
7:30pm: This is the latest chart as I sign off for the night. As you can see, the FTSE has gone my way, and I have lowered my protective stop to 6,040, so now I have a free ride...
(Click on the chart for a larger version)
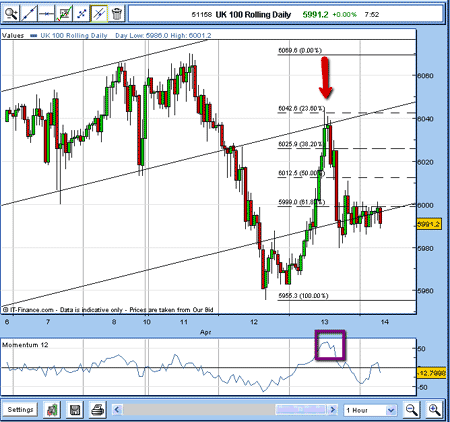
Thursday 14 April, 8:00am: Just to sum up Wednesday's action, my new short position on the FTSE was filled within a whisker of this high at 6,040 marked by red arrow (on overbought momentum, marked by purple box), and last night I lowered my protective stop to 6,040 break-even.
So nowI have another free ride.
Here is the state of play as of this morning:
(Click on the chart for a larger version)
After Wednesday's rally, the market is back to my lower tramline and toying with it. But I am on the lookout for a clear five-wave pattern down from Monday's 6,070 high, and will rest easier when I see it, I can assure you.
When I'm looking for major market tops (or bottoms), I like to see a clear minor five-wave move against the trend as this pattern normally indicates a change of major trend (you can read the glossary for more on Elliott wave patterns).
Odds are now favouring a dip to the recent 5,955 low. If this level can be breached, the selling should be intense, and I would be looking at a larger Elliott wave pattern with a break of 5,955 confirming a likely big third wave.
Recall, these are usually very strong and long. I may be looking to add to my short position if this develops.
Although I am getting a bit ahead of myself, I like to envisage a likely scenario for the near-term market behaviour, since a departure from it usually means I was wrong and I need to look to abandon my trade.
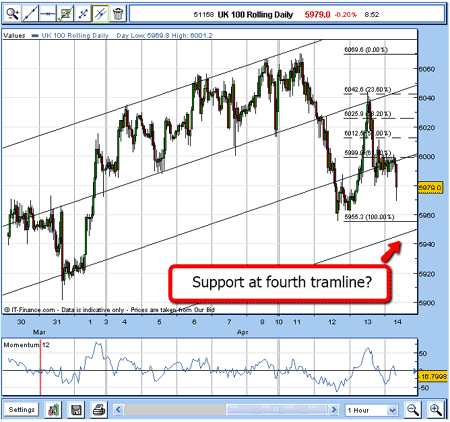
9:00am: The market is making its way down to my fourth tramline and the previous 5,955 low:
(Click on the chart for a larger version)
That should provide support. Let's see how it develops.
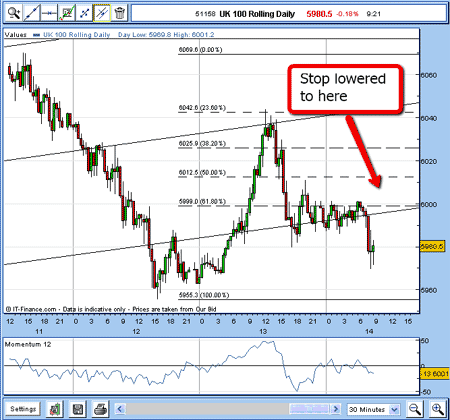
9:15am: I am gazing at the chart and see that there is a lot of congestion centred around my lowest tramline:
(Click on the chart for a larger version)
If the market rallies past that, then something else is going on! So that is where I will lower my buy-stop, just in case.
Buy stop lowered: Buy-stop lowered from break-even to 6,005. Now the worst-case scenario is that I make a 55 pip profit.
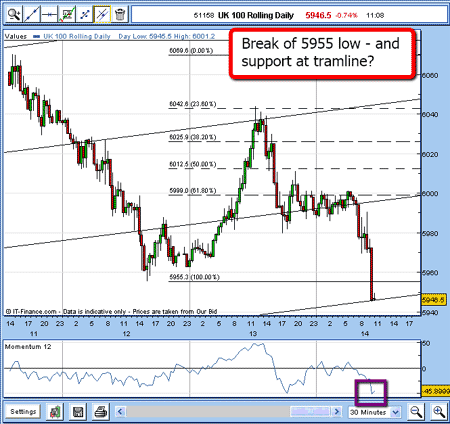
11:00am: I'm back in the office and see the selling has continued while I was away, and the market has broken the crucial 5,955 level and is resting on my tramline (drawn hours ago, please note):
(Click on the chart for a larger version)
I'll keep my protect-profit stop alone for now.
But I shall be looking for any bounce to add to short positions. With the 5,955 level broken, odds are firming that we are in a wave three of a major five-wave Elliott wave pattern. This baby could be a big one and I want to capitalise on it to the max.
I shall continue with this trade in my next blog. I hope this process of talking through my thought processes during a trade in as close to 'real-time' as I can make it is helpful let me know your comments below if you have a moment.
PS Just before I go, I have been asked by several readers which charting package I use. The answer is that I simply use the standard package provided by my spread betting company. All companies have one and they do the job nicely with all the tools I need. More advanced features can be found on paid-for services, if you wish. These carry more technical indicators and much more historical data so that back-testing of your systems can be done with ease.
NB: Don't miss my next trading insight. To receive all my spread betting blog posts by email, as soon as I've written them, just sign up here .
Get the latest financial news, insights and expert analysis from our award-winning MoneyWeek team, to help you understand what really matters when it comes to your finances.
John is is a British-born lapsed PhD physicist, who previously worked for Nasa on the Mars exploration team. He is a former commodity trading advisor with the US Commodities Futures Trading Commission, and worked in a boutique futures house in California in the 1980s.
He was a partner in one of the first futures newsletter advisory services, based in Washington DC, specialising in pork bellies and currencies. John is primarily a chart-reading trader, having cut his trading teeth in the days before PCs.
As well as his work in the financial world, he has launched, run and sold several 'real' businesses producing 'real' products.
-
 MoneyWeek Talks: The funds to choose in 2026
Podcast Fidelity's Tom Stevenson reveals his top three funds for 2026 for your ISA or self-invested personal pension
-
 Three companies with deep economic moats to buy now
Opinion An economic moat can underpin a company's future returns. Here, Imran Sattar, portfolio manager at Edinburgh Investment Trust, selects three stocks to buy now