How to profit from a 'split trade'
In spread betting, a 'split trade' gives a trader the opportunity to benefit from a move larger than the one originally targeted. Here's a good example.
Get the latest financial news, insights and expert analysis from our award-winning MoneyWeek team, to help you understand what really matters when it comes to your finances.
You are now subscribed
Your newsletter sign-up was successful
Want to add more newsletters?

Twice daily
MoneyWeek
Get the latest financial news, insights and expert analysis from our award-winning MoneyWeek team, to help you understand what really matters when it comes to your finances.

Four times a week
Look After My Bills
Sign up to our free money-saving newsletter, filled with the latest news and expert advice to help you find the best tips and deals for managing your bills. Start saving today!
In a previous post, I described a trade where I bet £2 on an outcome. I had a price target in mind, but wasn't sure if the market would carry on straight past it. I didn't want to give up on a big profit if the market decided to exceed my initial profit-taking point.
So here was my plan take the profit on the first £1 bet at my first target and let the other £1 ride. Meanwhile I would move my protective stop first to break-even, and then successively closer to the market. This is what I call a 'split trade'. It gives me the opportunity to benefit from a move larger than the one I had originally targeted.
Here is a good recent example using the EUR/USD currency pair.
MoneyWeek
Subscribe to MoneyWeek today and get your first six magazine issues absolutely FREE

Sign up to Money Morning
Don't miss the latest investment and personal finances news, market analysis, plus money-saving tips with our free twice-daily newsletter
Don't miss the latest investment and personal finances news, market analysis, plus money-saving tips with our free twice-daily newsletter
During November, the euro was aggressively sold, mainly on worries over sovereign debt and the possible break-up of the eurozone. There was speculation that the weaker nations, such as Ireland, Portugal, Italy, Spain, and Greece would float off on their own, with the stronger northern nations staying in.
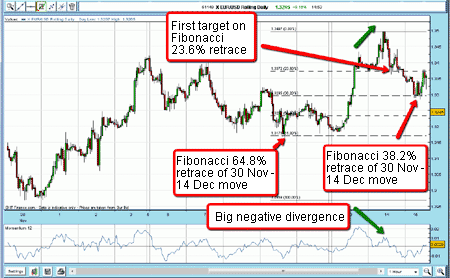
The decline from the 5 November 1.42 high to the 30 November 1.30 low was in a clear Elliott wave pattern of three waves down. Also, at the 1.30 low, there was a clear positive divergence with momentum. This is always a signal to me to watch out for a snap-back rally.
Also, at the end of November, sentiment was very much bearish on the euro. I have always remembered an old market maxim: "The market exists to surprise the majority". In this case, the majority were very definitely short the euro.
The snap-back rally duly took place took the market to just shy of the Fibonacci 38.2% retrace of the November decline. That was the first wave in an expected A-B-C rally.

The market then dropped back to a Fibonacci 50% retrace of the move from the 30 November low to the wave A top.
I find these multiple corrective waves usually reverse right on a Fibonacci retracement level.
It is well worth running your Fibonacci tool over your charts as a matter of course and that goes for even the shortest time-frame charts.
An Elliott wave A-B-C pattern forms
The market then rallied into a new high above wave A and I was on the lookout for a possible top in a wave C. On 14 December, the market surged to a spike high but on lower momentum than it had at Wave A a possible negative divergence with momentum.
I decided to do a split trade right there and set my stop 35 pips away using my 3% rule.
14 Dec sold £2 rolling EUR/USD @ 1.3480
Stop @ 1.3515
Risk £70 (1.4% of account)
Why was I looking for a top to wave C in the 1.35 area? Simply because that was right on the Fibonacci 38.2% retrace of the big move from the 5 November 1.4285 high and the 30 November 1.2970 low! I told you the Fibonacci tool on your spread-betting platform would be very valuable!
So the 1.35 area represented a good candidate for a top because:
A big negative divergence with momentum was present
A clear Elliott wave 3-wave pattern from the 30 November low (corrective)
A major Fibonacci retrace level was reached
As it turned out, that was indeed the top and the market fell back.
My first target was the Fibonacci retrace of wave C at 1.3370. I therefore entered a resting buy order there for the first £1 bet: as the market fell, I lowered my stop to break-even, following my break-even rule.
I was filled later that day:
14 Dec bought £1 rolling EUR/USD @ 1.3370
Profit 110 pips, £110
My free ride
I now had a free ride with the remaining £1 bet. If the market rallied back to my entry price, I would suffer no loss on that trade, and had to be content with the £110 profit on the first bet.
But the target for that was the next Fibonacci level (38.2%) at 1.3295, where I set my buy order, and was filled the very next day:
15 Dec bought £1 rolling EUR/USD @ 1.3295
Profit 185 pips £185
Total profit £295
From that point on, I was out of the market and content with my day trades.
I was then on the lookout for another promising situation, but felt that the market would need to do some consolidation for a few days before making its next move.
Of course, it is a lot more work short-term trading like this, rather than longer-term trading. If you were a position trader, you would seek to establish a position and sit on it, and stay with it until your stops are triggered.
A position trader would look for extremes, such as we saw at wave C, get short, use a wide stop, and just sit on this position. All the while they would be moving protective stops using a trailing stop method.
It's really horses for courses.
Get the latest financial news, insights and expert analysis from our award-winning MoneyWeek team, to help you understand what really matters when it comes to your finances.
John is is a British-born lapsed PhD physicist, who previously worked for Nasa on the Mars exploration team. He is a former commodity trading advisor with the US Commodities Futures Trading Commission, and worked in a boutique futures house in California in the 1980s.
He was a partner in one of the first futures newsletter advisory services, based in Washington DC, specialising in pork bellies and currencies. John is primarily a chart-reading trader, having cut his trading teeth in the days before PCs.
As well as his work in the financial world, he has launched, run and sold several 'real' businesses producing 'real' products.
-
 Barings Emerging Europe trust bounces back from Russia woes
Barings Emerging Europe trust has added the Middle East and Africa to its mandate, delivering a strong recovery, says Max King
-
 How a dovish Federal Reserve could affect you
Trump’s pick for the US Federal Reserve is not so much of a yes-man as his rival, but interest rates will still come down quickly, says Cris Sholto Heaton