Five reasons the gold rally is under threat
Gold's impressive rally continues. But are we nearing the end of the road for this recovery? John C Burford looks to the charts for clues.
Get the latest financial news, insights and expert analysis from our award-winning MoneyWeek team, to help you understand what really matters when it comes to your finances.
You are now subscribed
Your newsletter sign-up was successful
Want to add more newsletters?

Twice daily
MoneyWeek
Get the latest financial news, insights and expert analysis from our award-winning MoneyWeek team, to help you understand what really matters when it comes to your finances.

Four times a week
Look After My Bills
Sign up to our free money-saving newsletter, filled with the latest news and expert advice to help you find the best tips and deals for managing your bills. Start saving today!
Gold continues its impressive rally off the late December $1,530 low, having reached the $1,670 area over the weekend. But are we nearing the end of the road for this recovery?
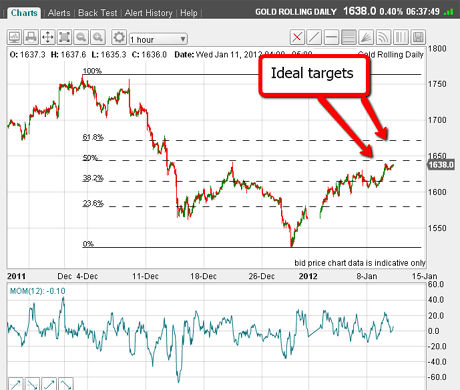
When I last wrote about gold, I had a chart showing the Fibonacci retrace levels where my upper target was indeed the $1,670 area. Here's that chart again:

(Click on the chart for a larger version)
MoneyWeek
Subscribe to MoneyWeek today and get your first six magazine issues absolutely FREE

Sign up to Money Morning
Don't miss the latest investment and personal finances news, market analysis, plus money-saving tips with our free twice-daily newsletter
Don't miss the latest investment and personal finances news, market analysis, plus money-saving tips with our free twice-daily newsletter
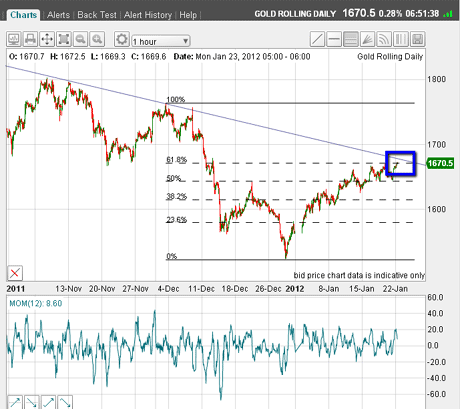
Here is the chart updated to this morning:

(Click on the chart for a larger version)
You can see how the major downtrend line off the $1,920 top meets the 62% Fibonacci retrace. This area in the blue box should represent major resistance.
But there is more, as I will show.
Gold is running into major resistance
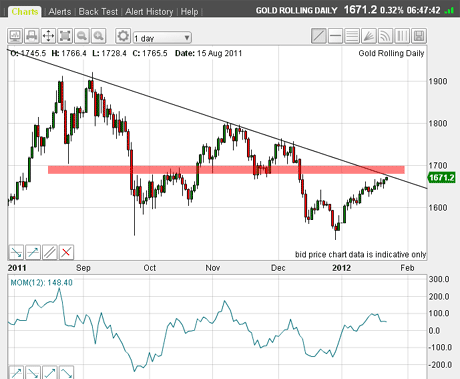
Take a look at this next chart the thick red bar shows the support/resistance zone for previous attempts on this level.

(Click on the chart for a larger version)
So let me just stress that. Not only is the market testing the 62% Fibonacci level and the major downtrend line drawn off the all-time $1920 high. It is also running into major resistance at the red bar.
This is a triple threat for further advances. But there's more
OK, now let's have a look at the latest COT (Commitments of Traders) report.
One of the clues that helped me identify the $1,920 top last year was the heavily overweight long futures holdings by the speculators. The short positions were held by 'the trade', which are considered the strong hands.
The trade is comprised mostly of the gold miners who are genuinely hedging their production now and into the future (the origin of the term 'futures'). The miners are not very concerned with movements in the underlying gold price, since they have already sold their production forward. That is why they are the strong hands as they will generally only lift their hedges as they make deliveries.
On the other hand, the speculators hedge funds and private traders are very much concerned with gold price movements! They are much more likely to trade in and out of positions based on price movements. The more leveraged the speculator, the weaker their hands. And look at the latest data
It's starting to look unstable
Here is the latest COT report:
| Hedge funds (large) | 167,000 | 31,000 |
| Small traders | 58,000 | 21,000 |
| Speculators (total) | 225,000 | 52,000 |
| The trade | 172,000 | 345,000 |
In the specs camp, for every short future held, there are 4.3 long futures.
This is veering towards the unstable and yet another reason to suspect a top is nigh.
Of course, it is unwise to time a trade solely on the basis of a COT report, but it is one piece of the jigsaw. And there's another clue that I think could point to a move lower in gold.
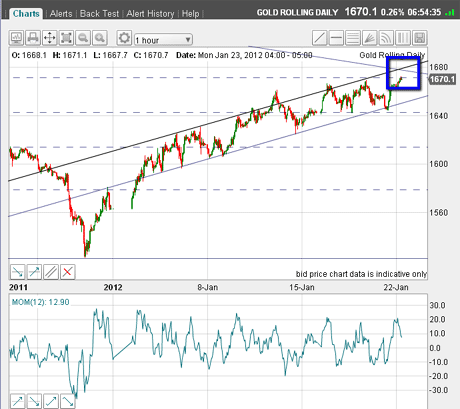
For this, let's return to my tramlines. Have a look at this chart of the January rally:

(Click on the chart for a larger version)
I showed these tramlines in my previous gold article and since then the market has been trading between them. The market is now approaching the upper tramline.
So add that to the case and we now have a quadruple threat to gold's rally!
Finally, there's even a potential fifth threat to the rally the high momentum reading, shown in this chart:

(Click on the chart for a larger version)
The momentum reading currently lies in the area identified with three previous highs. That could be another ominous sign for gold!
As I mentioned last time, I do have a concern that there is no clear A-B-C three-wave structure to this rally. That would be my ideal scenario.
So that would make my most likely forecast a top near current levels for the A wave, then a decline to a B wave low, and then a possible new high in the final C wave.
But with the specs crowding onto the long side again, we may well see a large dip that could blow this scenario out of the water.
Let's see how this plays out.
If you're a new reader, or need a reminder about some of the methods I refer to in my trades, then do have a look at my introductory videos:
The essentials of tramline trading
An introduction to Elliott wave theory
Advanced trading with Elliott waves
Don't miss my next trading insight. To receive all my spread betting blog posts by email, as soon as I've written them, just sign up here .
Get the latest financial news, insights and expert analysis from our award-winning MoneyWeek team, to help you understand what really matters when it comes to your finances.
John is is a British-born lapsed PhD physicist, who previously worked for Nasa on the Mars exploration team. He is a former commodity trading advisor with the US Commodities Futures Trading Commission, and worked in a boutique futures house in California in the 1980s.
He was a partner in one of the first futures newsletter advisory services, based in Washington DC, specialising in pork bellies and currencies. John is primarily a chart-reading trader, having cut his trading teeth in the days before PCs.
As well as his work in the financial world, he has launched, run and sold several 'real' businesses producing 'real' products.
-
 Average UK house price reaches £300,000 for first time, Halifax says
While the average house price has topped £300k, regional disparities still remain, Halifax finds.
-
 Barings Emerging Europe trust bounces back from Russia woes
Barings Emerging Europe trust has added the Middle East and Africa to its mandate, delivering a strong recovery, says Max King