Knowing when to exit a trade
One crucial thing that spread betters need to know is when to exit a trade. John C Burford illustrates a simple exit strategy, using recent action in the euro/US dollar market.
Get the latest financial news, insights and expert analysis from our award-winning MoneyWeek team, to help you understand what really matters when it comes to your finances.
You are now subscribed
Your newsletter sign-up was successful
Want to add more newsletters?

Twice daily
MoneyWeek
Get the latest financial news, insights and expert analysis from our award-winning MoneyWeek team, to help you understand what really matters when it comes to your finances.

Four times a week
Look After My Bills
Sign up to our free money-saving newsletter, filled with the latest news and expert advice to help you find the best tips and deals for managing your bills. Start saving today!
Early on in your trading/spread-betting career you will encounter the advice: "Always trade with the main trend". Sounds simple, doesn't it? If a market has been going up, you buy (go long). If the market has been going down, you sell (go short).
But if you've been around the markets for a while, then I'm sure you'll have discovered that, as with most 'rules', it's easier said than done. The fact is that you cannot simply jump into a position whenever you get the urge. The likely outcome is often very unpleasant.
In my previous posts, I've shown how to select winning trades with the trend in the AUS/USD using Elliott and Fibonacci principles. Here, I am using my tramline trading concepts to trade in short time-frames.
MoneyWeek
Subscribe to MoneyWeek today and get your first six magazine issues absolutely FREE

Sign up to Money Morning
Don't miss the latest investment and personal finances news, market analysis, plus money-saving tips with our free twice-daily newsletter
Don't miss the latest investment and personal finances news, market analysis, plus money-saving tips with our free twice-daily newsletter
Always have an exit strategy
One big question that is seldom addressed properly is when to exit a trade. This is an even tougher question than when to enter unless you have an exit strategy. I will give you one simple strategy in this example, using very recent action in the euro/US dollar (EUR/USD) market.
Let's start by looking at the question of entering a trending market. The recent action in the EUR/USD has been bullish the euro has been rising against the dollar. It's best to enter when the market is in a dip and at a place where it is likely turn back up (so that we're going with the trend). This will give the lowest-risk entry point, since it's then possible to set a protective stop at a level within the 3% risk tolerance. Of course, some traders are willing to use a wide stop say, over 150 pips in which case, the entry point need not be so fine-tuned.
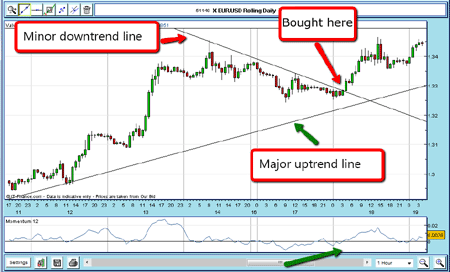
Below you can see the daily chart going back to early January. From 10 to 14 January, the market was in rally mode. As I noted above, the aim in this case is to go long, but after a dip. The market turned down on 17 January. It dipped to $1.3245, rallied slightly, then dipped again. The momentum reading was higher than at the first dip, giving a potential positive divergence.

(Click on the chart for a larger version)
A positive divergence with momentum is very often the precursor to a change in trend. This can work on any time-frame.
So a good technique here would be to set an entry 'buy' order just above the minor downtrend line. Incidentally, I like to draw minor trendlines in price corrections when there are at least three significant price extremes as you can see on the chart below:

(Click on the chart for a larger version)
The order would have been filled on 18 January as the market broke above the minor downtrend line. The low at $1.3250 now looks like a real one. So, I am ready to apply my straight line tool to see if any significant highs and lows line up.

(Click on the chart for a larger version)
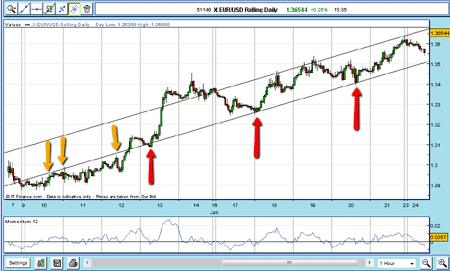
And yes, I draw my first tramline over the tops on 10, 11, and 12 January (yellow arrows), and then the low of 18 January (first red arrow).
Now I have my first tramline in place, I use my parallel line tool and see if any highs line up. But no real highs stand out, except the 14 January high. I keep that one in mind, as I need at least two highs.
Trading goes well with the market rallying on 18 January. It makes a high and backs off.
A very short-term trader could take profits of at least 100 pips then. But it would also be possible to stick with the trade, and move the protective stops to break-even using my break-even rule.
So now we have a good high at $1.3465 on 18 January. I can now draw my upper tramline.
Taking that high, I lay on my parallel line and it passes straight through a series of highs and lows in the complex made 13/14 January.

(Click on the chart for a larger version)
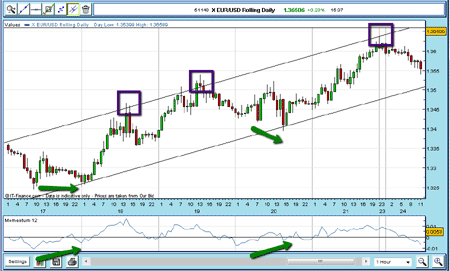
That gives a target for the trade where the market touches the newly-drawn upper tramline, in the $1.3510 area. This was hit the next day, 19 January (see chart below).

(Click on the chart for a larger version)
That would have been a good 200 pips-plus profit. (At this point it would also be possible to reverse positions and short-sell the market. Notice the momentum indicator negative divergence between the highs on 18 and 19 January a decline is indicated).
OK, the market is still trading between the tramlines, and drops to meet the lower tramline on 19 January. That would indicate a good point to buy again in the $1.3400 area. The market then went on to touch the upper tramline at the $1.3680 level (see above), which would again give a chance to take a profit of around 260 pips.
These are some possible trades for short-term spread-betting. On these two long trades, the profits would be at least 400 pips and on low risk, as they were bought on dips near to the tramline. Being more aggressive, and taking the short trade too, would have produced profits of at least 500 pips over just a couple of days.
Those who prefer longer-term trading can simply buy near uptrend lines and move a wide stop up in a trailing stop fashion (ie, keeping your back covered against sudden falls). The key is to identify reliable trendlines and like everything else in trading, that takes practice.
NB: Don't miss my next bit of trading advice. To receive all my spread betting blog posts by email, as soon as I've written them, just sign up here.
Get the latest financial news, insights and expert analysis from our award-winning MoneyWeek team, to help you understand what really matters when it comes to your finances.
John is is a British-born lapsed PhD physicist, who previously worked for Nasa on the Mars exploration team. He is a former commodity trading advisor with the US Commodities Futures Trading Commission, and worked in a boutique futures house in California in the 1980s.
He was a partner in one of the first futures newsletter advisory services, based in Washington DC, specialising in pork bellies and currencies. John is primarily a chart-reading trader, having cut his trading teeth in the days before PCs.
As well as his work in the financial world, he has launched, run and sold several 'real' businesses producing 'real' products.
-
 ISA fund and trust picks for every type of investor – which could work for you?
Whether you’re an ISA investor seeking reliable returns, looking to add a bit more risk to your portfolio or are new to investing, MoneyWeek asked the experts for funds and investment trusts you could consider in 2026
-
 The most popular fund sectors of 2025 as investor outflows continue
It was another difficult year for fund inflows but there are signs that investors are returning to the financial markets