How to use Elliott waves for entering short-term trades
If you're a spread better using leveraged positions, you must operate within very short time-frames. Here's how to use Elliott wave patterns for short-term trades
Get the latest financial news, insights and expert analysis from our award-winning MoneyWeek team, to help you understand what really matters when it comes to your finances.
You are now subscribed
Your newsletter sign-up was successful
Want to add more newsletters?

Twice daily
MoneyWeek
Get the latest financial news, insights and expert analysis from our award-winning MoneyWeek team, to help you understand what really matters when it comes to your finances.

Four times a week
Look After My Bills
Sign up to our free money-saving newsletter, filled with the latest news and expert advice to help you find the best tips and deals for managing your bills. Start saving today!
Elliott wave analysis can be very useful for giving a long-term view. It can give you very useful pointers as to which direction the market is heading in, where the current move is likely to end, and even how long it's likely to last.
But there's a major problem with this: obviously you can't know that a definitive wave pattern has been formed until it's over. That's fine if you're taking a long-term view you have plenty of time to react once you've seen that a pattern has definitely taken shape.
However, it's not very helpful if you're a spread better using leveraged positions. You need a much smaller time-frame in which to operate. It's no good knowing that the major trend in gold is up, and that it's in a major fifth wave (the last, biggest wave of the five you can read more about Elliott wave theory basics here), if you end up having to place a protective stop so far away from your entry point that it could wipe you out!
MoneyWeek
Subscribe to MoneyWeek today and get your first six magazine issues absolutely FREE

Sign up to Money Morning
Don't miss the latest investment and personal finances news, market analysis, plus money-saving tips with our free twice-daily newsletter
Don't miss the latest investment and personal finances news, market analysis, plus money-saving tips with our free twice-daily newsletter
That means you need to look out for Elliott waves on smaller timescales. And that in turn means that much of your forecasting will be tentative you can't wait until the trend is confirmed. You simply have to adapt your Wave labelling as the market progresses.
That makes it all the more important that you keep a tight grip on your risk level. As always, my 3% rule should keep you out of trouble.
A US dollar trade
Here's a great recent example of what I'm talking about. If you look back to early October, the US dollar had taken a hammering. You can understand why. The threat of more quantitative easing was hanging over it and the US economy remained weak. The fundamentals were grim.
However, looking at a long-term chart of the US dollar index, I could see that it was showing a three-wave Elliott pattern from its summer high. So it looked to me that the weakness was about to be reversed (remember, three-wave Elliott pattern moves are always counter-trend). That is one reason I felt bullish on the dollar and was looking for a point at which to go long, because the bearish opinion was at historic lows hovering at around 96% bearish for some time according to www.trade-futures.com.
This site gives a daily reading of the positions of retail investors for many markets. The principle is that the public are always wrong at major turning points (history shows this to be true) and extreme readings indicate that such a turning point lies just ahead. The greater the extremes, the faster they retrace.
So conditions were ideal for a sudden reversal. The big problem, of course, was timing my entry. Currency markets have an annoying tendency to stretch far beyond any reasonable expectations!
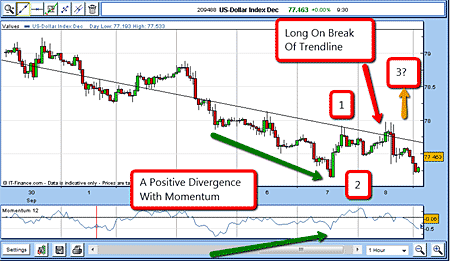
In early October, the December dollar index was drifting down to a new low of 77. On the 30-minute chart, on 7 October, the market made a low and then rallied (see the green arrows below). This signals a potential positive divergence with momentum. I use this feature extensively. If the market is making new lows after a steady downtrend, while the momentum is rising, it means that the selling pressure is weakening and a rally is due (but sadly, not guaranteed). Conversely, if the market is making new highs after a steady uptrend, while the momentum is falling, it means the buying pressure is weakening and a dip is due.

On the next day, 8 October, the dollar index fell back, but it found support above the 7 October low. I could then draw a pretty reliable downtrend line (shown above). If the index went above this line, I thought that might confirm the positive divergence with momentum, and even the wave 1 and 2 labelling (as you can see, wave 1 would in this case go from the 7 October low to the high, then wave 2 from the 7 October high to the point of support on 8 October).
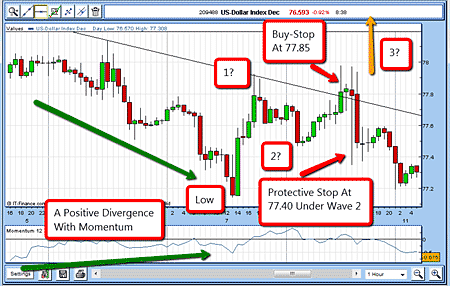
If that was to be true, then wave 3 up could well be a very strong one and take the US dollar up a few hundred pips very quickly. Great. So what strategy did I use to allow me to enter at low risk? Clearly, I had to go long with a resting buy-stop order placed just above the downtrend line at 77.85 (see chart below).

Now, if I was wrong, a move under wave 2 would prove it (that's the wave between '1?' to '2?' above). That would mean that my Elliott wave labelling was completely wrong, and I would need to go back to the drawing-board. So I placed my protective stop at 77.40 for a risk of 450 pips (£45 on a £1 bet).
And as you can see, I was indeed wrong. The dollar did not move up in a strong third Elliott wave, and I was stopped out a few hours later:
8 Oct long £1 Dec dollar index @ 77.85
Stop @ 77.40
Risk £45
8 Oct stopped out @ 77.400.
Loss £45
But that was not the end of the story! Elliott waves are wonderful, organic beings that can materialise in many guises. Sure, my initial labelling was wrong. But just after I was stopped out, the market rallied again, and then fell back, but continued to trade above the 7 October low.
So I could then tentatively move my label for wave 1 to the high just above the downtrend line, place wave 2 to the recent low, and then wave 3 might develop from there.
Get the latest financial news, insights and expert analysis from our award-winning MoneyWeek team, to help you understand what really matters when it comes to your finances.
John is is a British-born lapsed PhD physicist, who previously worked for Nasa on the Mars exploration team. He is a former commodity trading advisor with the US Commodities Futures Trading Commission, and worked in a boutique futures house in California in the 1980s.
He was a partner in one of the first futures newsletter advisory services, based in Washington DC, specialising in pork bellies and currencies. John is primarily a chart-reading trader, having cut his trading teeth in the days before PCs.
As well as his work in the financial world, he has launched, run and sold several 'real' businesses producing 'real' products.
-
 ISA fund and trust picks for every type of investor – which could work for you?
Whether you’re an ISA investor seeking reliable returns, looking to add a bit more risk to your portfolio or are new to investing, MoneyWeek asked the experts for funds and investment trusts you could consider in 2026
-
 The most popular fund sectors of 2025 as investor outflows continue
It was another difficult year for fund inflows but there are signs that investors are returning to the financial markets