The euro’s hitting powerful resistance, but a big rally could be on the cards
We could be at the start of a major rally in the euro, says spread betting expert John C Burford. Here, he explains why.
Get the latest financial news, insights and expert analysis from our award-winning MoneyWeek team, to help you understand what really matters when it comes to your finances.
You are now subscribed
Your newsletter sign-up was successful
Want to add more newsletters?

Twice daily
MoneyWeek
Get the latest financial news, insights and expert analysis from our award-winning MoneyWeek team, to help you understand what really matters when it comes to your finances.

Four times a week
Look After My Bills
Sign up to our free money-saving newsletter, filled with the latest news and expert advice to help you find the best tips and deals for managing your bills. Start saving today!
I am convinced that if you wish to be a successful trader, you must have a reliable system or method that you apply consistently in all market situations, as well as a solid money management discipline. Trading on hunches, or what the media or your favourite guru says (without supporting data), or buying what your brother-in-law is buying is not a reliable system.
I like to keep things as simple as possible and that is why I devised the tramline trading method. One of the three pillars of my method is the tramline system itself, which I devised. The other two are the Fibonacci levels and the Elliott wave model. Sometimes, the markets are perfectly aligned to allow full use of the tramline method, as I will show in the EUR/USD charts.
Recall that my tramlines are parallel lines of support (lower line) and resistance (upper line), with trading taking place inside the trading channel. None occurs outside of this channel if you have drawn your tramlines correctly.
MoneyWeek
Subscribe to MoneyWeek today and get your first six magazine issues absolutely FREE

Sign up to Money Morning
Don't miss the latest investment and personal finances news, market analysis, plus money-saving tips with our free twice-daily newsletter
Don't miss the latest investment and personal finances news, market analysis, plus money-saving tips with our free twice-daily newsletter
But occasionally, though, there are pigtails' that overshoot a line before the market quickly comes back inside the channel. There can also be a head fake', which is where a more substantial excursion outside of the trading channel occurs, but the market comes back into line inside the channel. Luckily, if you have drawn your tramlines correctly, these are rare.
My tramlines were picture-perfect, and that gave me confidence
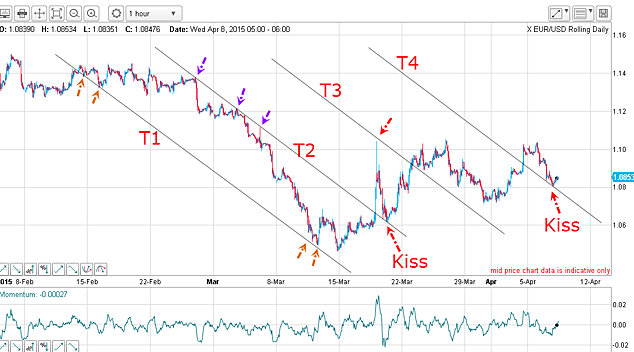
I showed my tramlines in the hourly EUR/USD chart

With my T1 in place, I then moved the parallel line to the upper highs and, lo and behold, it captured at least three accurate touch points (purple). That made my tramline pair a very reliable set and allowed me to set price targets above the pair in T3 and T4, which are equidistant.
After the huge spike to just over 1.10 shook loose the euro bears on 18 March, the market retreated back to T2 and planted a kiss smack on the line. That was the first of two landmark kisses.
When you see this kissing action, it offers you a terrific low-risk trade entry the kiss validates the tramline construction. T2 was broken to the upside on 18 March, so now instead of being resistance it automatically becomes a line of support, as verified by the kiss reversal on the line.
Trading the kiss is one of my top setups, because the tramline is a firm line in the sand if crossed, the support has given way and the kiss is cancelled. But if it holds, it confirms the line remaining as solid support. A stop loss placed just under the line is therefore possible.
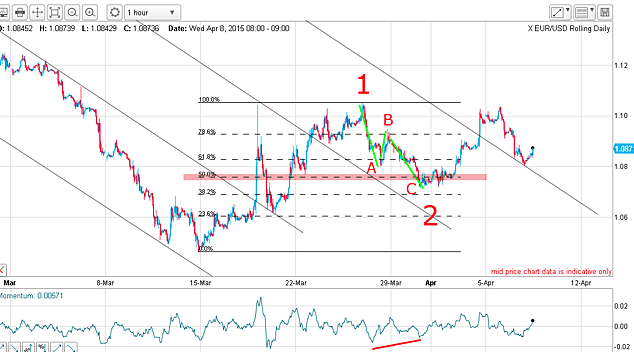
With the market having broken up through T4 as I forecast last time, is the kiss made last night genuine? If so, the rally is on towards the 1.10 zone. Let's look at the current hourly chart.

Since last time, the market has retreated further in a classic A-B-C three waves down (corrective action). That is telling me the trend has firmly turned up. In addition, the C wave terminated near the Fibonacci 50% level and on a solid positive momentum divergence (red bar).
According to my methods, this is the perfect setup for a long trade.
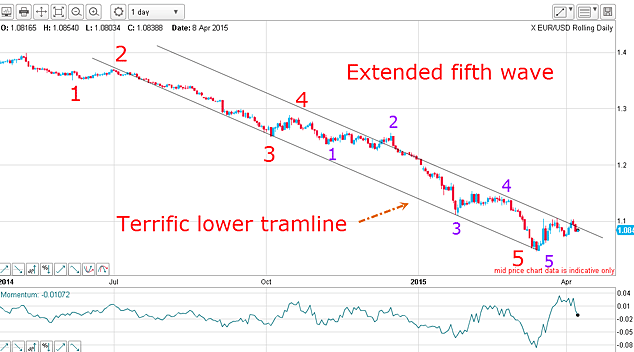
What does the big picture tell us about this rally?

And with that solid tramline in place, all I had to do was to move my parallel line and fix it where it catches many of the significant highs.
There is a massive head fake in December 2014, but other than that, my upper tramline catches the highs. That line is a solid line of resistance.
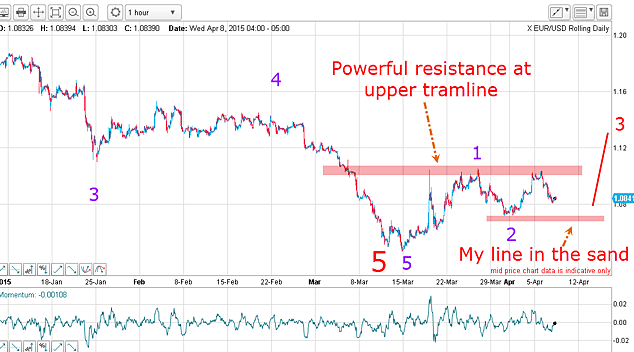
Today, the market has broken that line, but has retreated back inside the trading channel. The 1.10 region is proving a significant zone of resistance.
Note the huge swing in momentum off the March low. That reversal has caught many bears off guard and if the market can push up strongly past the 1.10 area and above the upper tramline, many more will be hurting.
My best guess today is that we are the start of a major wave 3 rally. On the hourly chart, the market has bounced three times off the 1.10 resistance zone, making waves 1 and 2 up: it is currently girding its loins for another attempt.

The key support is my wave 2 low my line in the sand. Breaking below that will make my bullish case much less secure. But so long as it holds, The odds favour a renewed push up, and this time if the 1.10 zone is breached, there will be a mass of buy-stops there ready to be ignited.
This market promises to provide even more excitement.
Get the latest financial news, insights and expert analysis from our award-winning MoneyWeek team, to help you understand what really matters when it comes to your finances.
John is is a British-born lapsed PhD physicist, who previously worked for Nasa on the Mars exploration team. He is a former commodity trading advisor with the US Commodities Futures Trading Commission, and worked in a boutique futures house in California in the 1980s.
He was a partner in one of the first futures newsletter advisory services, based in Washington DC, specialising in pork bellies and currencies. John is primarily a chart-reading trader, having cut his trading teeth in the days before PCs.
As well as his work in the financial world, he has launched, run and sold several 'real' businesses producing 'real' products.
-
 ISA fund and trust picks for every type of investor – which could work for you?
Whether you’re an ISA investor seeking reliable returns, looking to add a bit more risk to your portfolio or are new to investing, MoneyWeek asked the experts for funds and investment trusts you could consider in 2026
-
 The most popular fund sectors of 2025 as investor outflows continue
It was another difficult year for fund inflows but there are signs that investors are returning to the financial markets