Have we seen a true double top in gold?
The gold trade has been dominated by very bullish sentiment in recent times. But looking at the action in the charts, John C Burford thinks we've seen the top.
Get the latest financial news, insights and expert analysis from our award-winning MoneyWeek team, to help you understand what really matters when it comes to your finances.
You are now subscribed
Your newsletter sign-up was successful
Want to add more newsletters?

Twice daily
MoneyWeek
Get the latest financial news, insights and expert analysis from our award-winning MoneyWeek team, to help you understand what really matters when it comes to your finances.

Four times a week
Look After My Bills
Sign up to our free money-saving newsletter, filled with the latest news and expert advice to help you find the best tips and deals for managing your bills. Start saving today!
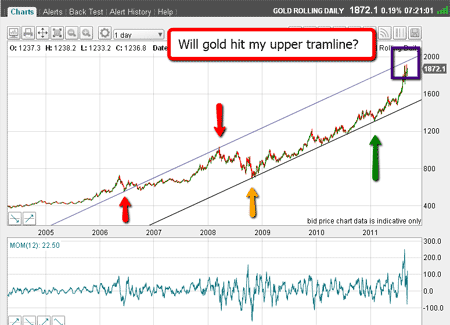
Last Friday, when I last wrote on the potential topping pattern in gold, I wondered if the two tops at the $1,920 area represented the end of the incredible gold bull market.
(Click on the chart for a larger version)
Recall that from the very long-term chart, I had identified a convincing tramline pair, where the upper tramline passed around $70 above the $1,920 area.
MoneyWeek
Subscribe to MoneyWeek today and get your first six magazine issues absolutely FREE

Sign up to Money Morning
Don't miss the latest investment and personal finances news, market analysis, plus money-saving tips with our free twice-daily newsletter
Don't miss the latest investment and personal finances news, market analysis, plus money-saving tips with our free twice-daily newsletter
Obviously, this would be a terrific upper target.
But I had my doubts that gold would make it.
As I have been emphasising all along with gold, the long trade was getting very crowded. In other words, just about everyone who was going to buy gold has probably already done so.
Bullish sentiment measures have been off the scale for some time, and I had not read a bearish article for many months.
We all know the 'fundamental' reasons for this trade, of course the relentless degradation of world currencies.
But the most dangerous thing a trader/investor can do is to jump on board a trend late in the day after being convinced, by all the extreme negative news about the dollar, that they must own gold.
The early birds, who saw the potential years ago, took positions against the prevailing opinion, and have been rewarded handsomely.
But it is my guess that there are very few of these traders compared with the numbers having jumped on board in the last year or so.
If a trader today can see the potential (in the other direction) early in the trend, they may be similarly rewarded.
The bulls are running scared
With the market down by around $150 in 11 days, many of the recent converts will be under water (or have jumped ship, nursing losses). The element of doubt is creeping into the bullish camp!
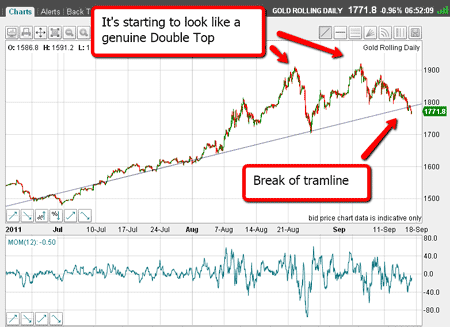
OK, here is the chart as of this morning:
(Click on the chart for a larger version)
I have drawn a good-looking tramline with several excellent touch-points both from above and below the line.
This morning, the market has broken below it a bearish sign. The key level of support is the major low of $1,700 made on 25 August.
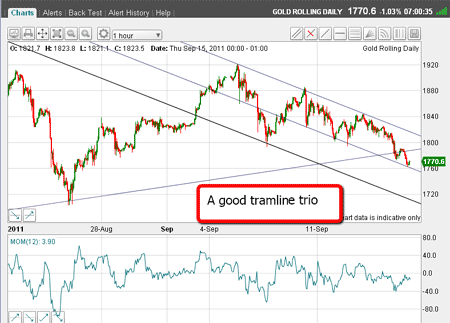
Let's look at the close-up chart:
(Click on the chart for a larger version)
From the $1,920 top, I have drawn my upper tramline, passing through the other two highs.
My centre tramline passes through many excellent touch points, and my lower one passes right through the major 7 September low.
These are good tramlines.
This morning, the market is hovering right on the centre tramline. If it can break decisively down from here, my lower tramline becomes my major target.
And because there is an overwhelming abundance of weak longs, we could well see a cascade of selling.
The trend confirms my suspicions of a double top
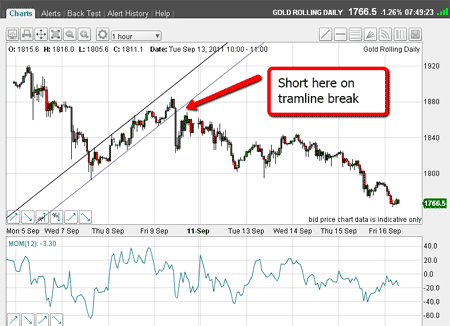
So how am I doing with my trade from last Friday? Here is the chart as of this morning:
(Click on the chart for a larger version)
I have drawn the tramlines from last Friday. My 'plan A' was to short if the market made it to my upper tramline.
As you can see, it did not make it, so I had to resort to my 'plan B', and shorted on a break of the lower tramline at $1,865.
My protective stop was at $1,885, and followed my 3% rule.
As the market dropped below $1,840, I lowered my stop to break-even, following my break-even rule.
OK, I have a nice short position with stops at break-even.
The market is knocking on the centre tramline and there is a potential small positive momentum divergence forming. The potential is there for a decent bounce.
But as of this morning, the trend is down and has vindicated my idea that we have a genuine double top in place.
Don't miss my next trading insight. To receive all my spread betting blog posts by email, as soon as I've written them, just sign up here .
Get the latest financial news, insights and expert analysis from our award-winning MoneyWeek team, to help you understand what really matters when it comes to your finances.
John is is a British-born lapsed PhD physicist, who previously worked for Nasa on the Mars exploration team. He is a former commodity trading advisor with the US Commodities Futures Trading Commission, and worked in a boutique futures house in California in the 1980s.
He was a partner in one of the first futures newsletter advisory services, based in Washington DC, specialising in pork bellies and currencies. John is primarily a chart-reading trader, having cut his trading teeth in the days before PCs.
As well as his work in the financial world, he has launched, run and sold several 'real' businesses producing 'real' products.
-
 Average income tax by area: The parts of the UK paying the most tax mapped
The UK’s total income tax bill was £240.7 billion 2022/23, but the tax burden is not spread equally around the country. We look at the towns and boroughs that have the highest average income tax bill.
-
 BBC TV licence fee hike confirmed: can you reduce how much you pay?
The cost of a TV licence fee is set to rise by over 3%, but there are ways to reduce the bill.