Something strange is happening in the US markets
Traders in the Dow have made the classic mistake of piling in at the top. John C Burford examines the charts to take advantage in his next trade.
Get the latest financial news, insights and expert analysis from our award-winning MoneyWeek team, to help you understand what really matters when it comes to your finances.
You are now subscribed
Your newsletter sign-up was successful
Want to add more newsletters?

Twice daily
MoneyWeek
Get the latest financial news, insights and expert analysis from our award-winning MoneyWeek team, to help you understand what really matters when it comes to your finances.

Four times a week
Look After My Bills
Sign up to our free money-saving newsletter, filled with the latest news and expert advice to help you find the best tips and deals for managing your bills. Start saving today!
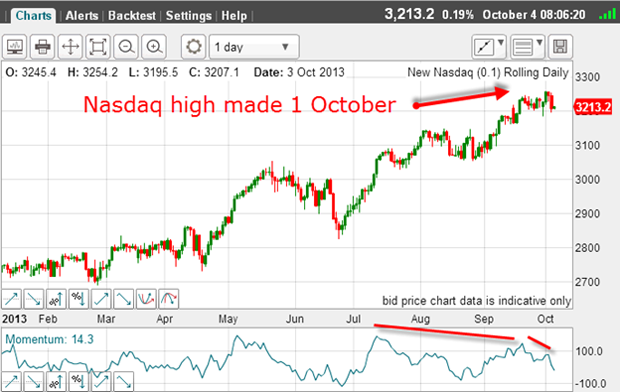
The US stock market decline off the 19 September high has been curious. The Dow has lost around 700 pips to this morning's low, while the Nasdaq has been powering higher until yesterday's break lower.
This has set up a large divergence between the two indexes.
Here is the daily Nasdaq chart:
MoneyWeek
Subscribe to MoneyWeek today and get your first six magazine issues absolutely FREE

Sign up to Money Morning
Don't miss the latest investment and personal finances news, market analysis, plus money-saving tips with our free twice-daily newsletter
Don't miss the latest investment and personal finances news, market analysis, plus money-saving tips with our free twice-daily newsletter

While the Dow was declining the Nasdaq was gaining, but on weakening momentum (red bars). These momentum divergences are waving a warning flag over the rally.
That means investors have been buying the more speculative Nasdaq equities and selling the more conservative, dividend-paying stocks that make up the Dow Jones Industrial Average.
Remember, not long ago, the strong investment advice was to invest in reliable dividend-paying stocks in order to take advantage of the higher yields offered, compared with risk-free' Treasury bonds.
I wonder what happened to that idea? I guess the risk-on trade is back.
But to me, this behaviour is very puzzling and may be one more bizarre outcome of the quantitative easing (QE) experiments being conducted.
Bizarre or not, the charts of the Dow and the Nasdaq remain patterned and I will analyse them using my established methods.
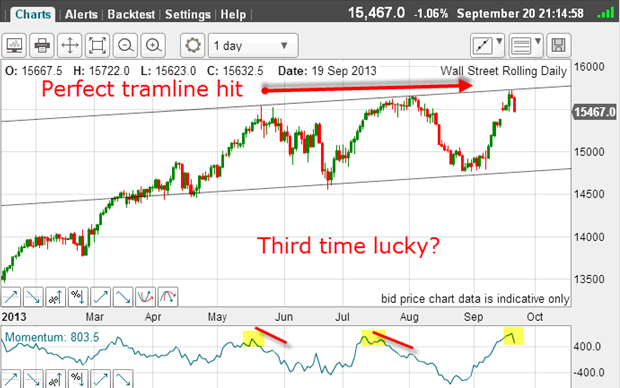
The fact that the Dow has traded between my tramlines (see chart below) with perfect reversal on the lines attests to the validity of this method.
Which side is weaker?

The rally to the 19 September high at 15,720 took the market to my upper tramline on overbought momentum (yellow highlight). Using my tramline trading rule, this was an excellent place to enter a short trade.
And at that point, what could give me a clue as to how far the decline off this top could carry?
I am looking for the side bulls or the bears that is most vulnerable to a reversal of fortunes. If I can identify a weakness, I will trade in that direction.
One place to look is the commitment of traders (COT) data, because if there are an overwhelming number of speculative longs compared with shorts around this top, the selling by this army of longs should be intense. With few shorts to offer buying pressure, the decline could be rapid.
And so it has proven. Here is the COT data for the Dow as of 24 September a few days after the 19 September high as the market was declining in what the bulls must have viewed as a buy-the-dip opportunity.
| ($5 x DJIA index) | Row 0 - Cell 1 | Row 0 - Cell 2 | Row 0 - Cell 3 | Open interest: 136,030 | ||||
| Commitments | ||||||||
| 58,005 | 8,407 | 558 | 59,969 | 117,067 | 118,532 | 126,032 | 17,498 | 9,998 |
| Changes from 09/17/13 (Change in open interest: -197) | ||||||||
| 20,015 | 530 | -4,253 | -16,865 | 17,362 | -1,103 | 13,639 | 906 | -13,836 |
| Percent of open in terest for each category of traders | ||||||||
| 42.6 | 6.2 | 0.4 | 44.1 | 86.1 | 87.1 | 92.7 | 12.9 | 7.3 |
| Number of traders in each category (Total traders: 103) | ||||||||
| 34 | 17 | 5 | 35 | 22 | 72 | 41 | Row 8 - Cell 7 | Row 8 - Cell 8 |
For the week ending 24 September, the hedge funds (non-commercials) actually increased their long positions by a whopping 53% from 38,000 contracts to 58,000. This is incredible.
This massive swing left them an almost seven-to-one ratio of longs to shorts.
This is the ultimate bullish mania! And it has revealed the weak side of this market: the bulls.
And this occurred right at the top of a major four-year-plus bull market.
You see what they were doing? They made the classic novice error of piling in at the top of a long bull market in other words, they bought high. And if the market does decline many thousands of pips in the next year or so, you can bet your boots they will be selling at the lows (as will the small speculators, who also swung to the bull side).
Incidentally, money flows into speculative US funds has broken records in recent weeks, confirming the extreme bullish sentiment.
Human nature doesn't change that is why an astute investor/trader, who can read the signals the markets offer, can avoid the costly mistakes of the herd.
OK, I have found from the COT data a clue that any decline in the Dow could be large.
Notice that I did not need any reference to the political gridlock in the USA to make this forecast. Many are laying the blame' of this decline on the shenanigans in the US Congress.
This is patently false, since the Nasdaq has been rallying!
Market commentators can get into a twist at times, and they provide much amusement for those of us who understand what really drives the markets.
No, my advice to all traders is to ignore the pundits and make your own analysis based on the charts and the economic data as you interpret it. Life becomes much simpler if you do.
Fuel for the rally

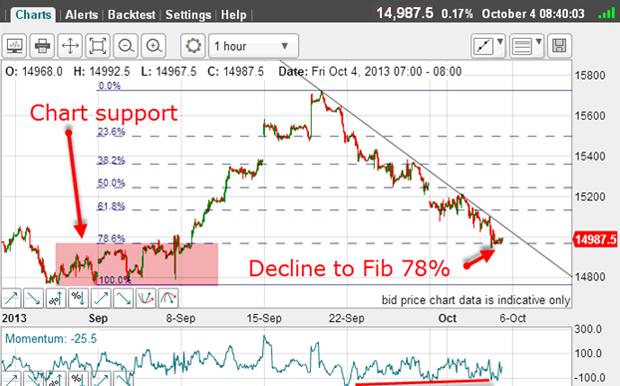
We have a decline right to the Fibonacci 78% retrace, and there is a slight positive-momentum divergence, but not enough to get truly excited about. The decline has been pretty relentless.
But lurking on the left of the chart is the highlighted heavy band of support. This could provide the fuel for a substantial rally.
That is reason enough to take profits on at least some of the short trades.
And if my downtrend line can be broken, then a decent rally could well get started. It may even offer a good trading opportunity from the long side.
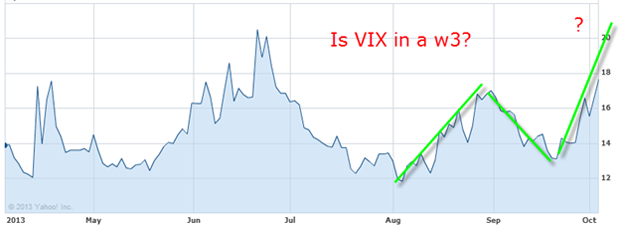
But near-term, the approaching debt ceiling deadline should stoke up volatility and here is the latest VIX volatility index:

From the low last August (complacency), the index appears to me to be in the early stages of a third wave up, which could take it above the previous high at 20.
The next couple of weeks should be very exciting and offer some great trades.
Get the latest financial news, insights and expert analysis from our award-winning MoneyWeek team, to help you understand what really matters when it comes to your finances.
John is is a British-born lapsed PhD physicist, who previously worked for Nasa on the Mars exploration team. He is a former commodity trading advisor with the US Commodities Futures Trading Commission, and worked in a boutique futures house in California in the 1980s.
He was a partner in one of the first futures newsletter advisory services, based in Washington DC, specialising in pork bellies and currencies. John is primarily a chart-reading trader, having cut his trading teeth in the days before PCs.
As well as his work in the financial world, he has launched, run and sold several 'real' businesses producing 'real' products.
-
 Average UK house price reaches £300,000 for first time, Halifax says
While the average house price has topped £300k, regional disparities still remain, Halifax finds.
-
 Barings Emerging Europe trust bounces back from Russia woes
Barings Emerging Europe trust has added the Middle East and Africa to its mandate, delivering a strong recovery, says Max King