Searching for gold’s elusive top
The whole world has been virtually unanimous on gold as the price soars ever higher. But what goes up must come down. Spread betting expert John C Burford has been keeping an eye on the charts, looking for signs of a turn-around.
Get the latest financial news, insights and expert analysis from our award-winning MoneyWeek team, to help you understand what really matters when it comes to your finances.
You are now subscribed
Your newsletter sign-up was successful
Want to add more newsletters?

Twice daily
MoneyWeek
Get the latest financial news, insights and expert analysis from our award-winning MoneyWeek team, to help you understand what really matters when it comes to your finances.

Four times a week
Look After My Bills
Sign up to our free money-saving newsletter, filled with the latest news and expert advice to help you find the best tips and deals for managing your bills. Start saving today!
I love gold; it is such a beautiful adornment on both men and women. Its rarity and immutable qualities have made it the pre-eminent store of wealth through the ages in ingot, coin and jewellery form.
But as a trader, I view it as a trading vehicle that's all.
I have watched it ascend to giddy heights in price as investors (including central banks) have exchanged their equity investments and their savings into gold holdings.
MoneyWeek
Subscribe to MoneyWeek today and get your first six magazine issues absolutely FREE

Sign up to Money Morning
Don't miss the latest investment and personal finances news, market analysis, plus money-saving tips with our free twice-daily newsletter
Don't miss the latest investment and personal finances news, market analysis, plus money-saving tips with our free twice-daily newsletter
I have stood by amazed at the mania for it.
In recent months, I have scoured the media for any glimmer of bearishness, but came up empty-handed.
I have quoted investor sentiment readings of over 95% continuously in fact, one reading I saw on Monday put the bullish consensus at 98%!
What goes up must come down
The whole world has been virtually unanimous on gold.
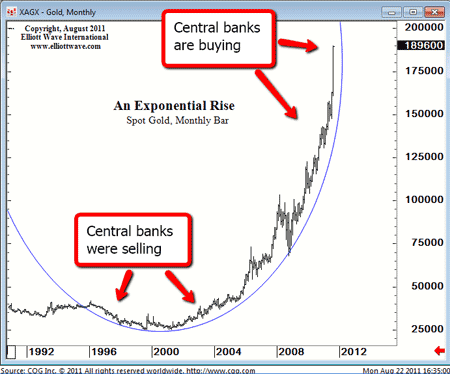
We all know the reasons, so I won't repeat them here. I will simply draw your attention to this chart, prepared before yesterday's $90 drop:

(Click on the chart for a larger version) (Chart courtesy ofelliottwave.com)
That is some herd behaviour!
The rise has been vertical, and we all know that what goes up must come down.
And central banks, who have a great record of waiting to act until the trend is about to change, have been vigorously buying of late, along with the public.
You may be wondering who was doing the selling, if the case for gold is so iron-clad.
Of course, it's the trade (mines, processors), who are usually considered the smart' money.
Alright, with yesterday's $90 dip, the bulls will be feeling a little less certain of their position. There has been a shot across their bows and their armada is being challenged.
There has not been a $90 down day (or up day) for a very long time.
As you know, I have been keeping an eagle eye on the charts, looking for signs of a turn-around. Why? Because when the bubble pops, we will very likely see several hundred dollars wiped off gold in a matter of days.
Now that is a prize worth going for.
Looking for clues to the top
Were there any clues to give me for a possible top yesterday?
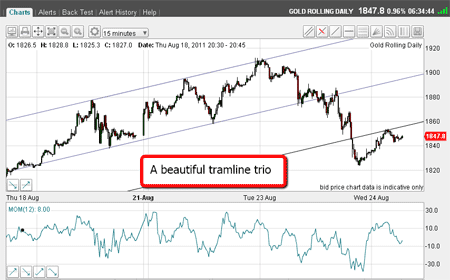
As ever, let's go back to the charts. Here is the 15-minute chart (I am using this scale to show the detail):

(Click on the chart for a larger version)
Yesterday, I saw the lovely five-wave pattern and joined up the lows for my central tramline.
I then drew a parallel line across the tops. That was a very good fit.
Then, I drew an equidistant tramline below.
But as the market was coming off the high at $1,912, I recognised the small pattern it was (possibly) making.
I therefore jumped the gun a little and shorted as the market began a spike down to my central tramline. My protective stop was just above the $1,912 high well within my 3% rule.
I believed that if the market could break below that central tramline, it could go much further.
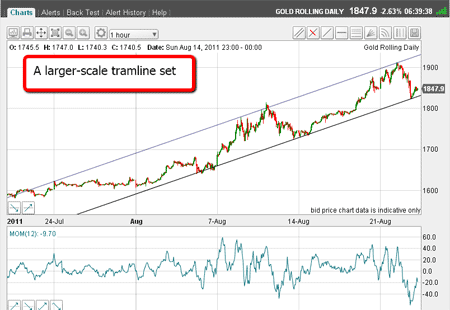
I then needed a target for this possible move. Here is the longer-range chart:

(Click on the chart for a larger version)
I have my tramline pair, which is a great fit on the significant highs and lows.
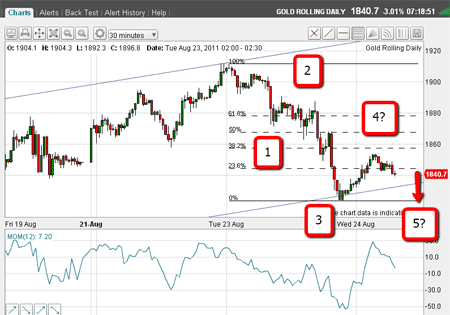
And last night, the market dropped right to the lower line and then rallied off the line. Here it is in close-up:

(Click on the chart for a larger version)
OK, now we have a bounce, but will the market go on to make new highs?
I have labelled my idea of the Elliott wave count and it seems we may have one more wave down the fifth.
If this was to happen, the wave-5 low would lie below my lower tramline and produce a break.
If this occurs, I will be looking for an A-B-C corrective pattern.
So now, the market is deciding whether to rally up to one of the Fibonacci levels (marked on the chart) to complete the fourth wave, or go ahead and put in that fifth wave.
Testing times indeed for gold.
On Monday, I left the Dow where I had an upside target, which has been slightly exceeded. I hope to return to it soon.
Don't miss my next trading insight. To receive all my spread betting blog posts by email, as soon as I've written them, just sign up here .
Get the latest financial news, insights and expert analysis from our award-winning MoneyWeek team, to help you understand what really matters when it comes to your finances.
John is is a British-born lapsed PhD physicist, who previously worked for Nasa on the Mars exploration team. He is a former commodity trading advisor with the US Commodities Futures Trading Commission, and worked in a boutique futures house in California in the 1980s.
He was a partner in one of the first futures newsletter advisory services, based in Washington DC, specialising in pork bellies and currencies. John is primarily a chart-reading trader, having cut his trading teeth in the days before PCs.
As well as his work in the financial world, he has launched, run and sold several 'real' businesses producing 'real' products.
-
 Can mining stocks deliver golden gains?
With gold and silver prices having outperformed the stock markets last year, mining stocks can be an effective, if volatile, means of gaining exposure
-
 8 ways the ‘sandwich generation’ can protect wealth
People squeezed between caring for ageing parents and adult children or younger grandchildren – known as the ‘sandwich generation’ – are at risk of neglecting their own financial planning. Here’s how to protect yourself and your loved ones’ wealth.