Profit as the Dow bulls and bears do battle
With the bulls and the bears fighting it out in the Dow, the market's falls and rallies will be sharp and sudden. That means big profits for quick short-term traders and patient long-term traders, says John C Burford.
Get the latest financial news, insights and expert analysis from our award-winning MoneyWeek team, to help you understand what really matters when it comes to your finances.
You are now subscribed
Your newsletter sign-up was successful
Want to add more newsletters?

Twice daily
MoneyWeek
Get the latest financial news, insights and expert analysis from our award-winning MoneyWeek team, to help you understand what really matters when it comes to your finances.

Four times a week
Look After My Bills
Sign up to our free money-saving newsletter, filled with the latest news and expert advice to help you find the best tips and deals for managing your bills. Start saving today!
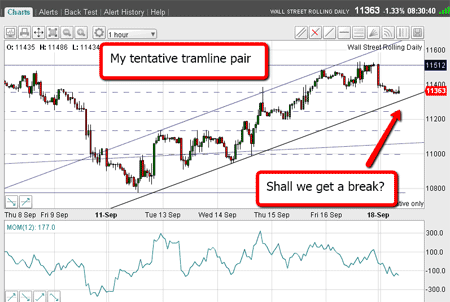
When I last covered the Dow on 19 September, the Dow had made a lovely textbook Fibonacci retrace rally and was about to challenge my short-term tramline.
How things have changed over the intervening fortnight.
Here is the chart back then:
MoneyWeek
Subscribe to MoneyWeek today and get your first six magazine issues absolutely FREE

Sign up to Money Morning
Don't miss the latest investment and personal finances news, market analysis, plus money-saving tips with our free twice-daily newsletter
Don't miss the latest investment and personal finances news, market analysis, plus money-saving tips with our free twice-daily newsletter

(Click on the chart for a larger version)
My opinion then was that a good break of this tramline would confirm the resumption of the bear market and a likely assault on the early August 10,450 low.
But I was a little early the market had a little more work to do on this rally.
Yes, I did get a good tramline break, but the market staged a second rally on 20 September to reach a level slightly above the previous 16 September high.
I was watching to see if the market could make further progress, because if it could, that would probably indicate a much bigger rally was in the making.
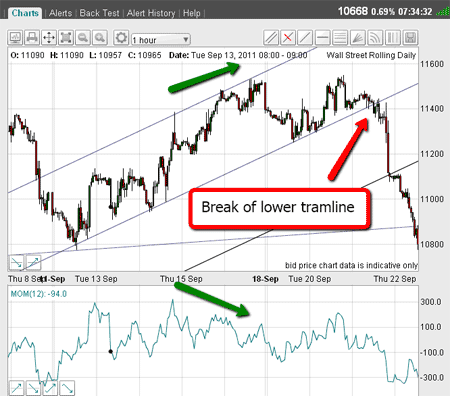
But the market backed off from this level and I was then able to draw a new set of up-sloping tramlines containing trading for the week of 12-16 September.

(Click on the chart for a larger version)
There are some superb touch-points on both tramlines, and when I saw the break of the lower one, that is when I believed we should see the (delayed) resumption of the bear market. Sell orders were indicated at this break.
So now I could draw my third (lower) tramline to use as a target and see what happened when the market reached that line. It simply sliced right through it.
That was a very bearish sign and indicated to me big falls lay ahead.
The lowest tramline near the bottom of the chart is my tramline drawn off the early August 10,450 low. The market even sliced right through that one as well that is how bearish the market had become.
The bulls and bears do battle
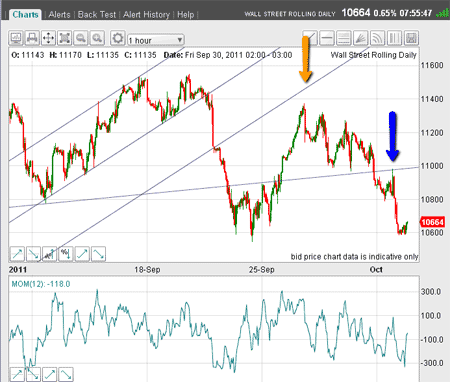
OK, now let's update the chart to this morning.

(Click on the chart for a larger version)
This overshoot of the main tramline was overdone note the sold-out momentum readings near the 10,600 level. And there is a positive momentum divergence at these lows! (just ahead of 25 September).
Time to take profits on the shorts for a solid 750 pip gain - or £750 per £1 spread bet.
And indeed, the market did rally from this oversold position. In fact, it carried right to near the underside of one of my tramlines (marked by yellow arrow) and on overbought momentum!
That was some change of sentiment in only two days! From zero to hero.
This action simply illustrates that there is a tremendous battle being waged between the bulls and the bears at present.
The market then resumed its downward move and broke through the lower tramline last Friday, but then staged a brief rally to 'kiss' the tramline (marked by the blue arrow), and then made a 'scalded cat bounce' away.
Isn't that a pretty confirmation that, despite all the volatile action seen over the past two months, my old tramline still has the power to act as a line of resistance to rallies?
Big profits to come?
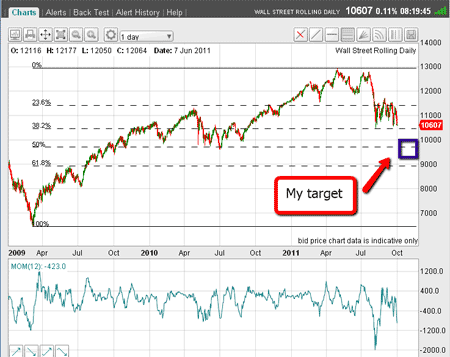
OK, where are we in the big picture? Here is the daily chart going back to the March 2009 low:

(Click on the chart for a larger version)
I have drawn in my Fibonacci retrace levels using the March 2009 low and the May 2011 high as anchor points.
Already, the plunge to the early August low hit the 38% level on the button. So that gives me confidence that this set of Fibonacci levels is still operating.
That means the next Fibonacci level is the 50% retrace. That is sub-10,000.
I have high confidence in this target, especially because for the past two months, the market has been trading in a wide range, and now it seems to be breaking to the downside.
There has been a build-up of many long positions that will need to be liquidated as the market continues to fall below this range. This is called a 'large head of supply'.
Declines will continue to be sharp but so will the rallies.
Short-term trading will require nimble feet, while position (long-term) trading will require patience. There will potentially be big profits for both.
If you're a new reader, or need a reminder about some of the methods I refer to in my trades, then do have a look at my introductory videos:
The essentials of tramline trading
An introduction to Elliott wave theory
Don't miss my next trading insight. To receive all my spread betting blog posts by email, as soon as I've written them, just sign up here .
Get the latest financial news, insights and expert analysis from our award-winning MoneyWeek team, to help you understand what really matters when it comes to your finances.
John is is a British-born lapsed PhD physicist, who previously worked for Nasa on the Mars exploration team. He is a former commodity trading advisor with the US Commodities Futures Trading Commission, and worked in a boutique futures house in California in the 1980s.
He was a partner in one of the first futures newsletter advisory services, based in Washington DC, specialising in pork bellies and currencies. John is primarily a chart-reading trader, having cut his trading teeth in the days before PCs.
As well as his work in the financial world, he has launched, run and sold several 'real' businesses producing 'real' products.
-
 UK interest rates live: experts expect MPC to hold rates
The Bank of England’s Monetary Policy Committee (MPC) meets today to decide UK interest rates. The last meeting resulted in a cut, but experts think there is little chance of interest rates falling today.
-
 MoneyWeek Talks: The funds to choose in 2026
Podcast Fidelity's Tom Stevenson reveals his top three funds for 2026 for your ISA or self-invested personal pension