An important Fibonacci retracement in the Dow
After the Dow Jones put in a sharp rally last week, it is displaying a textbook example of how markets often obey Fibonacci theory. John C Burford explains.
Get the latest financial news, insights and expert analysis from our award-winning MoneyWeek team, to help you understand what really matters when it comes to your finances.
You are now subscribed
Your newsletter sign-up was successful
Want to add more newsletters?

Twice daily
MoneyWeek
Get the latest financial news, insights and expert analysis from our award-winning MoneyWeek team, to help you understand what really matters when it comes to your finances.

Four times a week
Look After My Bills
Sign up to our free money-saving newsletter, filled with the latest news and expert advice to help you find the best tips and deals for managing your bills. Start saving today!
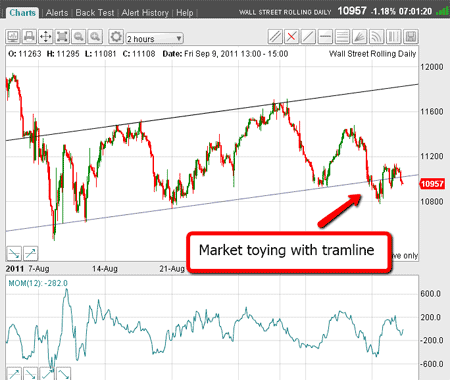
I last left the Dow on Wednesday in a state of indecision. The market had broken below my lower tramline drawn off the lows made since the 8 August low at 10,450. But it had not made a decisive break down to my pencilled-in fifth wave low below 10,450.
As I explained, I could not have confidence that the market was fully ready to resume the bear trend right away. The market was swinging around the tramline with no clear trend (at least in the short term).
I had a notion that we could get a sharp rally.
MoneyWeek
Subscribe to MoneyWeek today and get your first six magazine issues absolutely FREE

Sign up to Money Morning
Don't miss the latest investment and personal finances news, market analysis, plus money-saving tips with our free twice-daily newsletter
Don't miss the latest investment and personal finances news, market analysis, plus money-saving tips with our free twice-daily newsletter
And so my suspicions were confirmed with the market rallying by around 700 pips since last Monday.
Here is the chart from Wednesday:

(Click on the chart for a larger version)
This puts my lovely tramline pair into question. It seems I may have to abandon this pattern, but it has served me well since early August, giving me my wave C top at the 11,450 area on 8 September, and a great shorting opportunity.
So where might the bear market rally turn around?
But now the market pushed slightly above that level on Friday. Here is the hourly chart as of this morning:

(Click on the chart for a larger version)
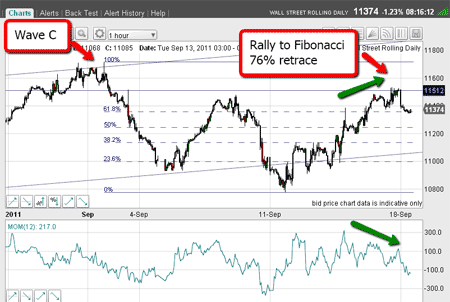
Now I am ready to draw in my Fibonacci retrace levels to give me an idea of from where the bear market rally could turn around.
Because the market did push above the intermediate high made on 8 September, I have to go back to the wave C high for my high pivot.
My low pivot is obviously last Monday's low. So now I have my pivot points and the rally has carried right to the Fibonacci 76% level.
Incidentally, on my platform, the Fib tool does not contain the 76% level for some mysterious reason, and so I have to draw it in by hand and that is the solid line at the 11,500 level.
I have prepared a video tutorial on how I use the Fibonacci tool, so watch out for it coming very soon. There, I show how even a beginning trader can use this most powerful tool without delay.
Now, this is a deep retracement, but not unusual. Remember, we are in a bear market and there are many traders who have joined in the bear camp.
We should expect sharp counter-trend rallies as the weaker of these traders are squeezed out of their positions.
Trader tip: Monitor the financial headlines. When all is gloom and doom, expect a sharp rally, especially when momentum readings are low. By the time a particular view has appeared in the mainstream, the short-term trend is usually ready to reverse. Last week was a superb example.
That is why I prefer to short on strength, if at all possible. That gives me the lowest-risk entries.
And there is another clue that we have seen the top of last week's rally there is a stark negative momentum divergence.
Remember, a weakening momentum on rising markets usually means that the rally is running out of steam and is about to reverse.
And I can see a possible A-B-C three-wave (corrective) pattern in last week's rally, with wave C sporting a negative momentum divergence.
A textbook example of Fibonacci theory
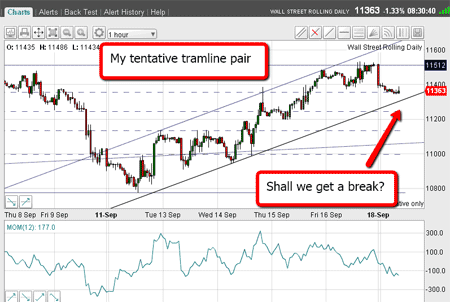
Now I can start looking for tramlines on last week's rally. Here is the hourly chart again:

(Click on the chart for a larger version)
I have drawn my first pair and while the upper one looks fine, I am not totally happy with the lower one, but currently, it is the best I can do.
But right away, you can see how the Fibonacci 76% level was touched perfectly on Friday, but over the weekend, the market had hit the brick wall and was retreating.
Isn't that a lovely textbook example of how markets often obey the Fibonacci theory of growth and decay of natural systems?
My first target is of course the lower tramline. And a sharp break of that would help confirm my view that we have seen the top on Friday, and the odds are now swinging towards a resumption of the bear market and an assault on the early August 10,450 low.
Don't miss my next trading insight. To receive all my spread betting blog posts by email, as soon as I've written them, just sign up here .
Get the latest financial news, insights and expert analysis from our award-winning MoneyWeek team, to help you understand what really matters when it comes to your finances.
John is is a British-born lapsed PhD physicist, who previously worked for Nasa on the Mars exploration team. He is a former commodity trading advisor with the US Commodities Futures Trading Commission, and worked in a boutique futures house in California in the 1980s.
He was a partner in one of the first futures newsletter advisory services, based in Washington DC, specialising in pork bellies and currencies. John is primarily a chart-reading trader, having cut his trading teeth in the days before PCs.
As well as his work in the financial world, he has launched, run and sold several 'real' businesses producing 'real' products.
-
 Average UK house price reaches £300,000 for first time, Halifax says
While the average house price has topped £300k, regional disparities still remain, Halifax finds.
-
 Barings Emerging Europe trust bounces back from Russia woes
Barings Emerging Europe trust has added the Middle East and Africa to its mandate, delivering a strong recovery, says Max King