The Dow looks for direction as it wobbles along the tramlines
After making a top at around 11,450, the Dow Jones is wobbling back and forth along the tramlines as it tries to decide its next direction. John C Burford hunts for clues in the charts.
Get the latest financial news, insights and expert analysis from our award-winning MoneyWeek team, to help you understand what really matters when it comes to your finances.
You are now subscribed
Your newsletter sign-up was successful
Want to add more newsletters?

Twice daily
MoneyWeek
Get the latest financial news, insights and expert analysis from our award-winning MoneyWeek team, to help you understand what really matters when it comes to your finances.

Four times a week
Look After My Bills
Sign up to our free money-saving newsletter, filled with the latest news and expert advice to help you find the best tips and deals for managing your bills. Start saving today!
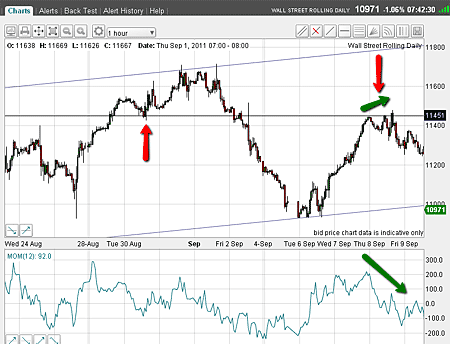
When I left the Dow last week, the market had rallied to a Fibonacci retrace level where I put in another short trade in the 11,400 area.
I should mention that this trade was inspired by more evidence of a top there than just the Fibonacci retrace.
Here is the chart as of last week:
MoneyWeek
Subscribe to MoneyWeek today and get your first six magazine issues absolutely FREE

Sign up to Money Morning
Don't miss the latest investment and personal finances news, market analysis, plus money-saving tips with our free twice-daily newsletter
Don't miss the latest investment and personal finances news, market analysis, plus money-saving tips with our free twice-daily newsletter

(Click on the chart for a larger version)
I have drawn a horizontal line across the significant low at 11,450 made on 30 August.
Trading tip: These recent lows are often points of resistance for subsequent rallies, and points where rallies are reversed. Keep a keen eye out for them on your charts they can give you added ammunition for your trades.
So I had two reasons to believe this area would mark the top of the rally. Odds were strengthening in my favour.
After I had put on my trade, I noted that momentum was falling away rapidly as the tops were being put in. I have marked this by the green arrows.
This was producing a negative momentum divergence.
So my confidence was growing that I had found the top for that rally and indeed, the market proceeded to sell off heavily right back to my lower tramline and beyond.
In fact, the market made an overshoot to the 10,800 area on Monday.
The Dow is showing no clear direction
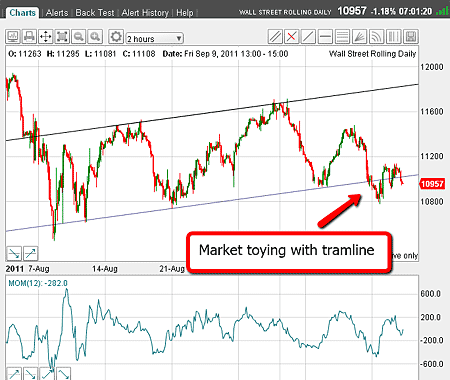
Here is the chart showing the consolidation pattern since early August:

(Click on the chart for a larger version)
I have slightly re-drawn my tramlines to make a better fit, especially to the lows.
Trading tip: When dealing with extremely volatile markets, such as we have with the Dow, you may have to re-jig your tramline positions somewhat to make a better fit. Of course, this may alter your projections by a wide margin, so be prepared!
As you can see, the market has been swinging from one side of the tramline to the other as it tries to decide its next direction.
As you know, I expect new lows below 10,450 in a large fifth Elliott wave. If you need to review why fifth waves are significant, see my video tutorial An introduction to Elliott wave theory.
But there is often many a slip from cup to lip.
One possible fly in the ointment is the fact thatit hasnot yet broken significantly below my lower tramline to confirm we are in wave 5.
I have explained that the 10,450 low made on 9 August is a wave 3, and the rally to 11,700 on 1 September is a wave 4.
This interval is called 'wave 4', and may not be the simple A-B-C correction I had pencilled in.
It may, in fact, be an even more complex pattern that evolves. We may see a series of ups and downs contained within a large triangle pattern before the market decides to retreat to new lows.
That would mean that rallies off my lower tramline could carry to the 11,200 area (a Fibonacci retrace level).
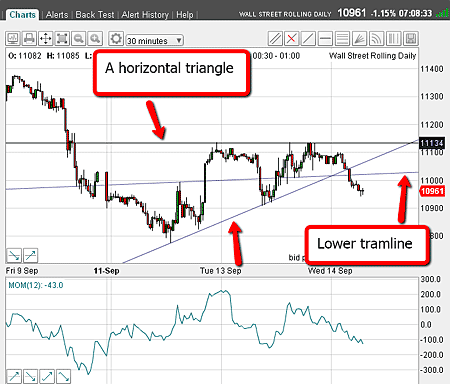
Here is a close-up of recent action as of this morning:

(Click on the chart for a larger version)
Once again, our old friend the horizontal triangle appears (recall, we saw just this pattern in gold. I have marked the lines defining the triangle with red arrows.
Note we have had a break down from the sloping line overnight, as well as a move below my lower tramline.
This break should be followed by a rally attempt to get back to this triangle line. This is typical behaviour after a sharp break.
But first, the market has to deal with my lower tramline. That may be sufficient resistance to turn the market back down. Note the several exact touch points.
But if not, the next resistance is the up-sloping triangle line in the 11,050 area.
And pushing up through that would shift the odds in favour of my 11,200 target. And that would be a terrific place for me to short.
But as of this morning, I am seeing no clear direction, and will be sitting on my short positions, especially the trades taken in the 12,800 area.
Don't miss my next trading insight. To receive all my spread betting blog posts by email, as soon as I've written them, just sign up here .
Get the latest financial news, insights and expert analysis from our award-winning MoneyWeek team, to help you understand what really matters when it comes to your finances.
John is is a British-born lapsed PhD physicist, who previously worked for Nasa on the Mars exploration team. He is a former commodity trading advisor with the US Commodities Futures Trading Commission, and worked in a boutique futures house in California in the 1980s.
He was a partner in one of the first futures newsletter advisory services, based in Washington DC, specialising in pork bellies and currencies. John is primarily a chart-reading trader, having cut his trading teeth in the days before PCs.
As well as his work in the financial world, he has launched, run and sold several 'real' businesses producing 'real' products.
-
 MoneyWeek Talks: The funds to choose in 2026
Podcast Fidelity's Tom Stevenson reveals his top three funds for 2026 for your ISA or self-invested personal pension
-
 Three companies with deep economic moats to buy now
Opinion An economic moat can underpin a company's future returns. Here, Imran Sattar, portfolio manager at Edinburgh Investment Trust, selects three stocks to buy now