Now I’ve got a clear signal on the Dow
The Dow Jones has been foggy until now. But using his chart-trading methods, John C Burford clears a path to his next trade.
Get the latest financial news, insights and expert analysis from our award-winning MoneyWeek team, to help you understand what really matters when it comes to your finances.
You are now subscribed
Your newsletter sign-up was successful
Want to add more newsletters?

Twice daily
MoneyWeek
Get the latest financial news, insights and expert analysis from our award-winning MoneyWeek team, to help you understand what really matters when it comes to your finances.

Four times a week
Look After My Bills
Sign up to our free money-saving newsletter, filled with the latest news and expert advice to help you find the best tips and deals for managing your bills. Start saving today!
When we apply the Elliott wave model to real-time market action, there are usually two or more valid paths for a market. But sometimes there are just two main competing 'best guess' scenarios that seem to have about the same odds of turning out to be right.
Nowhere is this dilemma more acute than in the question of whether a three-wave move is in reality going to be an A-B-C or a 1-2-3 section of a five-wave pattern. These two scenarios lead to opposite conclusions.
If the move turns out to be an A-B-C, then it will reverse when the C wave completes and the market will resume along its main trend (A-B-C patterns are counter-trend). But if it is a 1-2-3, then the rally will immediately continue in a long and strong wave 3.
MoneyWeek
Subscribe to MoneyWeek today and get your first six magazine issues absolutely FREE

Sign up to Money Morning
Don't miss the latest investment and personal finances news, market analysis, plus money-saving tips with our free twice-daily newsletter
Don't miss the latest investment and personal finances news, market analysis, plus money-saving tips with our free twice-daily newsletter
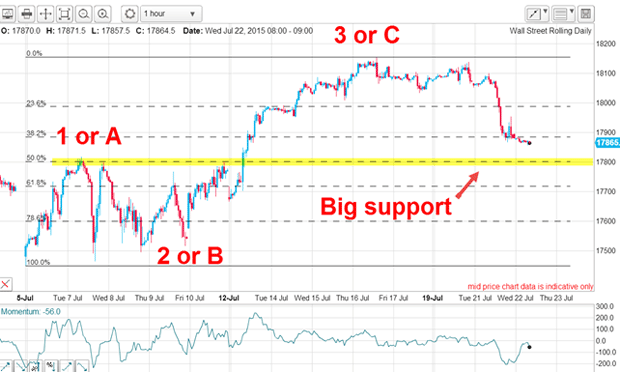
In my postof last Wednesday, I showed you a chart displaying the two options:

My original thought that the market was likely in a five-wave rally that had the potential to break into new highs.
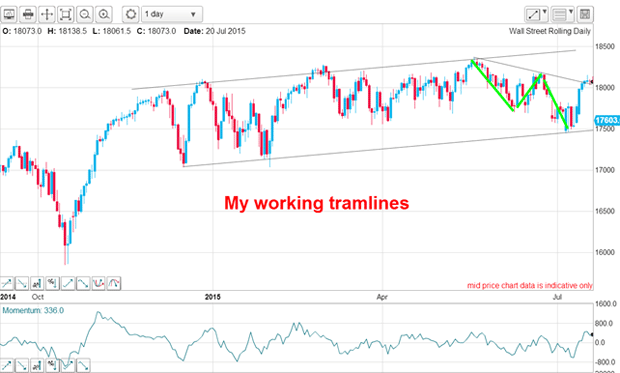
The daily chart from that same postshowed the overall medium-term position. The market was still in a clear uptrend (higher highs and higher lows) and the latest bounce off my upper tramline was an uptrend-confirming A-B-C (green lines).

My small downtrend line had been broken, again confirming the uptrend. The odds were definitely on the side of the 1-2-3 interpretation.
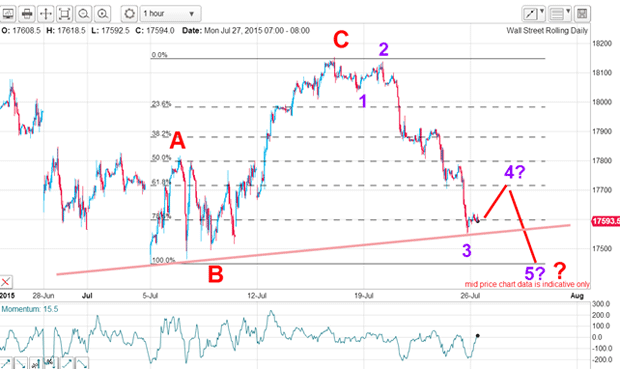
But my line in the sand was the highlighted support area shown in my first chart. If the market could break that, all bets for a five up were off. Sure enough, the market has broken that support and this is the hourly chart this morning:

The market dropped hard last night (Sunday) and is testing the lower tramline on the daily chart. That means I can quite confidently label the July rally as an A-B-C and place wave labels on the decline. The important point to note is that the decline off the wave 2 high last Monday is long and strong a give-away that the move is a third wave and not the C wave of an A-B-C down.
The Dow bulls are bailing out
That trade was taken without recourse to the larger wave labels. Sometimes, you just have to spot an opportunity and jump aboard.
This morning, the fog is starting to clear. A solid break of my lower tramline (after a small-scale rally in wave 4, perhaps?) would really help solidify my original idea that the May 19 high at 18,365 was the top of the entire 2009 2015 rally.
But the market is also testing the Fibonacci 78% retrace of the A-B-C rally a potential support zone. However, note the momentum chart which is showing a very unusual pattern. Last Friday when the market was falling hard, momentum naturally fell to low levels, as expected.
But in overnight trading, when the market made a very weak rally, momentum has rocketed back up towards overbought levels! If all it takes to become overbought is for just a weak rally, what does that say of the state of the market? I will let you draw your own conclusions.
Financial tug-of-war will make the next six months a great time to swing trade
If you recall the depths of the credit crunch in 2007 2009, the Dow fell from 14,000 in 2007 to the 6,500 area in March 2009 a massive decline of over 50%. From that low, the market has rallied by over 175% in the central-bank inspired QE (quantitative easing) and Zirp (zero interest rate policy)operations which accompanied the rally in bullish sentiment. That rally is one of the longest in US history.
But the rally was built on the massive increase in easy credit the Fed made available to markets. So far in 2015, however, the Dow has gone nowhere in fact it is well down on the year. What is going on?
To my mind, this year has been a titanic struggle between the forces of inflation (2009 2014) and deflation. The huge churning in the Dow this year is the result of the tug-of-war between them. The signs of deflation have been there for all to see from zero and even negative Consumer Price Index data to bond defaults (Greece, Puerto Rico) and the China stock market collapse (margin debt has shrunk).
The historic debt levels accumulated since 2009 are being severely tested. Already cracks are starting to appear and once fear gets a hold, deflation will surely follow and markets will feel the pinch. The second half of 2015 will surely be full of excitement and great profit opportunities for nimble swing traders.
Get the latest financial news, insights and expert analysis from our award-winning MoneyWeek team, to help you understand what really matters when it comes to your finances.
John is is a British-born lapsed PhD physicist, who previously worked for Nasa on the Mars exploration team. He is a former commodity trading advisor with the US Commodities Futures Trading Commission, and worked in a boutique futures house in California in the 1980s.
He was a partner in one of the first futures newsletter advisory services, based in Washington DC, specialising in pork bellies and currencies. John is primarily a chart-reading trader, having cut his trading teeth in the days before PCs.
As well as his work in the financial world, he has launched, run and sold several 'real' businesses producing 'real' products.
-
 Japanese stocks rise on Takaichi’s snap election landslide
Japan’s new prime minister Sanae Takaichi has won a landslide victory in a snap election, prompting optimism that her pro-growth agenda will benefit Japanese stocks
-
 Alphabet 'is planning a 100-year bond': would you back Google for 100 years?
Google owner Alphabet is reported to be joining the rare century bond club