Nikkei at 14,000 is my target
Japan’s Nikkei index is offering terrific examples of how to set medium or long term price targets, says John C Burford. And right now it’s heading for a good place to take some profits.
Get the latest financial news, insights and expert analysis from our award-winning MoneyWeek team, to help you understand what really matters when it comes to your finances.
You are now subscribed
Your newsletter sign-up was successful
Want to add more newsletters?

Twice daily
MoneyWeek
Get the latest financial news, insights and expert analysis from our award-winning MoneyWeek team, to help you understand what really matters when it comes to your finances.

Four times a week
Look After My Bills
Sign up to our free money-saving newsletter, filled with the latest news and expert advice to help you find the best tips and deals for managing your bills. Start saving today!
Today, I will cover Japan's Nikkei index, as it is offering terrific examples of how to set medium or long term price targets when in a very strong trend.
Naturally, if you have a position in a strongly trending market and it is going your way you will tend to become more and more convinced you have a whale' trade on your hands. And you start to dream about early retirement to that dream home in Tuscany.
As the profits keep piling up, you glance at your equity regularly and start to believe you are a genius!
MoneyWeek
Subscribe to MoneyWeek today and get your first six magazine issues absolutely FREE

Sign up to Money Morning
Don't miss the latest investment and personal finances news, market analysis, plus money-saving tips with our free twice-daily newsletter
Don't miss the latest investment and personal finances news, market analysis, plus money-saving tips with our free twice-daily newsletter
Well, maybe you don't think this way,but many do.
But anyone who bought into gold in 2005 2011 will tell you that profits can disappear, usually much more quickly than they were made. And many now regret not taking a massive profit when it was offered near the $1,920 high.
If you have experienced this, you will know that it puts an enormous strain on your psyche - not to mention your account balance.
So how can you tell when is a good time to exit a profitable position? After all, it is very frustrating to get out of a good position too early and leave money on the table.
I have a secret: there's no sure-fire way to do this.
But I do have a method that can help fix your targets where you can take partial profits in a sensible way provided the markets cooperate, of course.
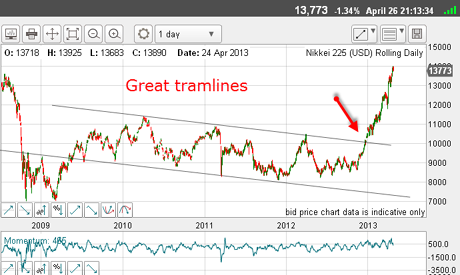
Here is the Nikkei over the last few years:

(Click on the chart to see a larger version)
I started getting bullish on the Nikkei last year when it was trading in the 9,000 area. Then, when it broke above my upper tramline on 2 January with a gap opening, that was another strong buy signal (red arrow).
Since then, the market has been relentlessly moving higher and higher, propelled in part by the strong bear market in the Japanese yen.
The new prime minister, Shinzo Abe, has pledged to lift the economy out of deflation. He wants 2% inflation, and he plans to have the Bank of Japan print mountains of yen in order to achieve it. The new government policy has been labeled Abenomics' in his honour.
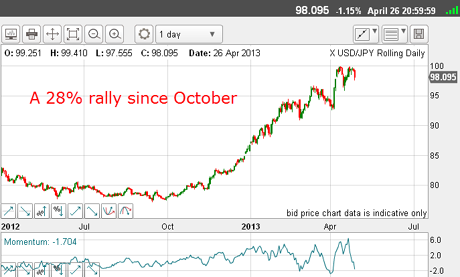
The markets - which were heavily long the yen - were caught in a trap. Many began exiting their positions in droves, and this has created a huge bull market in my trade of 2012, USD/JPY.
Here is the chart of this cross:

(Click on the chart to see a larger version)
Since October, there has been a huge 28% rise in the USD/JPY. By comparison, the rise since October in the Nikkei has been a staggering 65%.
So, the rise in the Nikkei has been twice as large as the loss in the exchange rate. This is a notable disconnect.
Evidently, the stock traders are expecting Japanese company profits to far exceed the gains from currency conversion all this from the Abenomics money-printing effect.
To profit from the Nikkei, play the percentages
I'm sure there are many bulls who have visions of seeing that 35,000 level again.
A glance back at the Nikkei chart will reveal that there was a huge base building from mid-2009 to the end of 2012 two and a half years.
This was a period when there was little interest in buying Japanese shares. Many old timers lost a lot of money betting on a Japan recovery over the years, and are understandably gunshy.
OK, so you are long the Nikkei, and you are nervous about the straight-up rally, knowing that these conditions do not last forever.
You will be looking to at least lighten up. So where can you look for guidance?
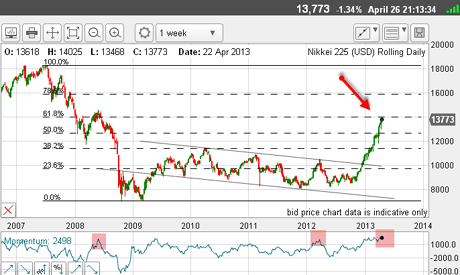
Let's go back to the very long-term chart and apply the Fibonacci tool with high pivot to the 2007 major top, and the low pivot to the 2009 low:

(Click on the chart to see a larger version)
Right away, we see the market last week hit the 14,000 level, which is an exact Fibonacci 62% retrace of the big move down off the 2007 top (red arrow).
This is a very significant level. Also, momentum on the daily chart is back up at levels where previous tops were made (pink bars).
So, simply by keeping an eye on the long-term Fibonacci labels, you can get good ideas for your targets.
Of course, there is no guarantee the market will top out here. As we all know, anything is possible in the markets.
But playing the percentages this is a great place to look at banking some profit.
After all, there are few things more miserable for a trader than seeing a mighty profit dwindle because you failed to take profits at a sensible place.
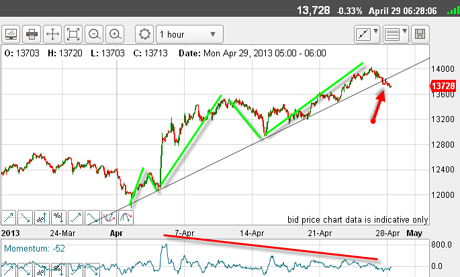
To back up this idea, I always look at the shorter-term picture for more clues:

(Click on the chart to see a larger version)
Here is the hourly chart. Right away, I can see a small tramline break (red arrow). I can rely on the lower tramline especially because of the many exact touch points.
Also, this move up from the early April lows is a five-wave form with a negative momentum divergence at the fifth wave top. And we know that when five waves have played out, the next move is likely down.
This is a very clean Elliott wave example. And some traders will be going short here, looking for a major correction. So the evidence is piling up for at least a temporary top at the 14,000 level.
And if you had entered your trade at the 9,000 area, you would be sitting on a profit of 5,000 pips in just a few months.
To my mind, taking at least some of that off the table makes a lot of sense.
Not bad, eh?
If you're a new reader, or need a reminder about some of the methods I refer to in my trades, then do have a look at my introductory videos:
The essentials of tramline trading Advanced tramline trading An introduction to Elliott wave theory Advanced trading with Elliott waves Trading with Fibonacci levels Trading with 'momentum' Putting it all together
Don't miss my next trading insight. To receive all my spread betting blog posts by email, as soon as I've written them, just sign up here . If you have any queries regarding MoneyWeek Trader, please contact us here.
Get the latest financial news, insights and expert analysis from our award-winning MoneyWeek team, to help you understand what really matters when it comes to your finances.
John is is a British-born lapsed PhD physicist, who previously worked for Nasa on the Mars exploration team. He is a former commodity trading advisor with the US Commodities Futures Trading Commission, and worked in a boutique futures house in California in the 1980s.
He was a partner in one of the first futures newsletter advisory services, based in Washington DC, specialising in pork bellies and currencies. John is primarily a chart-reading trader, having cut his trading teeth in the days before PCs.
As well as his work in the financial world, he has launched, run and sold several 'real' businesses producing 'real' products.
-
 ISA fund and trust picks for every type of investor – which could work for you?
Whether you’re an ISA investor seeking reliable returns, looking to add a bit more risk to your portfolio or are new to investing, MoneyWeek asked the experts for funds and investment trusts you could consider in 2026
-
 The most popular fund sectors of 2025 as investor outflows continue
It was another difficult year for fund inflows but there are signs that investors are returning to the financial markets