My 2016 forecast: new highs in Dow, then a deflationary collapse
Spread betting expert John C Burford applies his trading methods to the charts to see what the new year holds for the markets.
Get the latest financial news, insights and expert analysis from our award-winning MoneyWeek team, to help you understand what really matters when it comes to your finances.
You are now subscribed
Your newsletter sign-up was successful
Want to add more newsletters?

Twice daily
MoneyWeek
Get the latest financial news, insights and expert analysis from our award-winning MoneyWeek team, to help you understand what really matters when it comes to your finances.

Four times a week
Look After My Bills
Sign up to our free money-saving newsletter, filled with the latest news and expert advice to help you find the best tips and deals for managing your bills. Start saving today!
This is my last postbefore the New Year and although there has been little snow this season, I will veer a little off-piste today.
I have just returned from a holiday in the Canary Islands and naturally, my thoughts turned to the Spanish stock index and how it might compare with my main trading vehicle, the Dow. Not that I would wish to trade the lesser index, but I wanted to see how the global economic forces impacted both indexes. Are there any points of comparison I could draw? Or are they two separate indexes that go their separate ways?
On Sunday, the Spanish elections result threw a spanner in the governance works by moving much more left-wing, thus unnerving investors. Interestingly, the market anticipated this result by moving to a new low on Monday (and is currently in rally mode in a classic 'sell the rumour, buy the news' effect).
MoneyWeek
Subscribe to MoneyWeek today and get your first six magazine issues absolutely FREE

Sign up to Money Morning
Don't miss the latest investment and personal finances news, market analysis, plus money-saving tips with our free twice-daily newsletter
Don't miss the latest investment and personal finances news, market analysis, plus money-saving tips with our free twice-daily newsletter
It is a fact that stock indexes of different nations display a wide variety of chart patterns with some in rally mode and others in a bear trend. Elliott wave technicians need to examine each index separately.
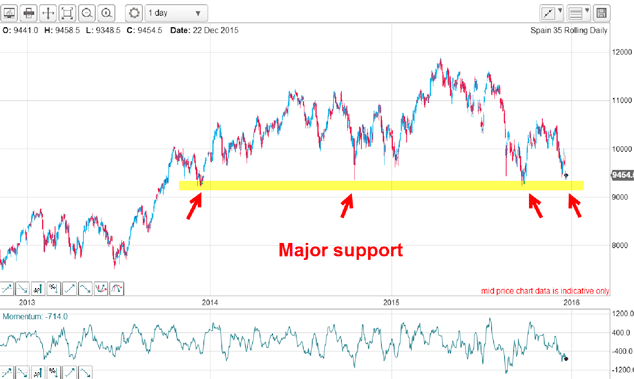
Here is the Spanish 35 index on the daily chart back to 2013:

Try as I might, I am unable to place clear Elliott wave labels here and thereby lies a lesson. Not every chart you examine will be amenable to a good Elliott wave interpretation. Only trade the clear set-ups.
To achieve that, I need to see a clearly defined set of waves 1, 2 and 3 of a potential five up or down, or an A-B-C correction. In 2015, I have shown a whole host of examples in real time markets of how I trade these waves.
My two all-time favourite trade set-ups are: getting in early on a third wave of a five up or down, and finding the C wave extreme of a correction that resolves in the direction of the main trend.
But with the Spanish 35 chart, I see no such set-up. But I do see one clear feature the massive shelf of support at the 9,300 level. For the past two years, this level has held four separate attempts at breaking it. This is a very significant level. It is being tested again this week.
And to slightly contradict myself, if this level holds and the market moves back up, the move off the April high to Monday's low is a decent A-B-C, but without the confirming momentum divergence at the C wave low.
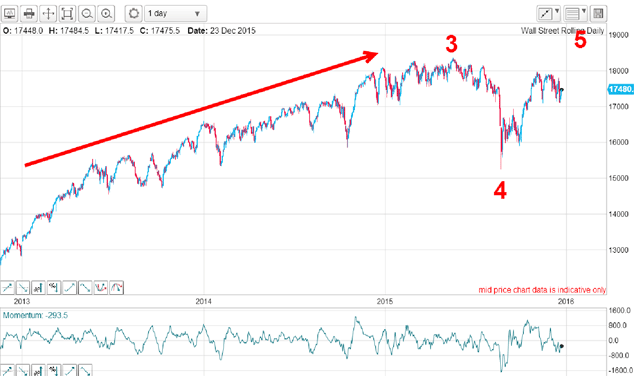
So how does this compare with the Dow in the same period?

Here, the bull market to May 2015 is clear and my wave labels are also high probability. The August swoon was my wave 4 and we are currently in the final wave 5 which should take the market to a new all-time high. That is the conclusion I draw from my large-scale analysis.
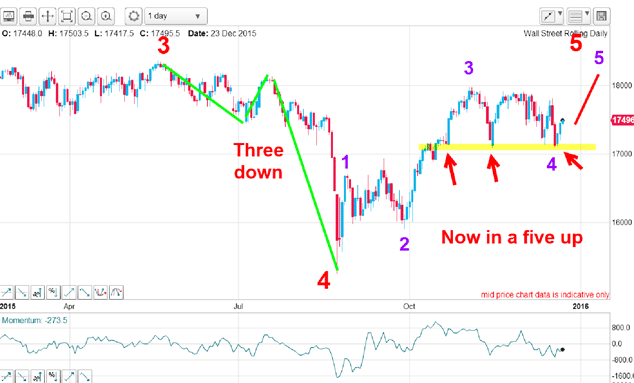
So are there any points of comparison with the Spanish 35? Here is a close-up of the Dow of the wave 5:

The Dow is showing a much clearer Elliott wave pattern than the Spanish 35. The latter is a much thinner traded index and these often do not show clear patterns in either tramlines, Elliott waves or Fibonacci levels. I generally avoid trading thin markets.
The wave 4 to the August plunge low can be counted as a corrective A-B-C. Then, the rally pattern shows all the hallmarks of a not yet completed five up within the large red five wave.
And the one point of similarity is the shelf of support (yellow highlight) although of shorter duration that in the Spanish 35. Here, there are three accurate hits on it with the latest occurring last Friday. As in the Spanish 35, this is a very significant level of support.
And the dip to Friday's low is my purple wave 4 low and as I write, the market is rallying at the start of the purple wave 5. This wave will be the final sub-wave of the large red wave 5. It should end above 18,365 all-time high of May.
Interestingly, bullish sentiment towards the S&P 500 has recently reached extremely low levels. Just last week, the DSI (Daily Sentiment Index) recorded a reading of only 5% bulls. This is an extremely low reading from which previous rallies have been mounted. That boosts my case for a substantial rally into the New Year.
But not all indexes will likely participate in reaching new highs.
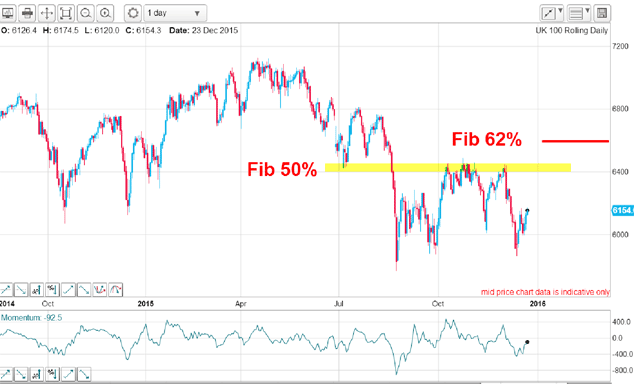
Here is the FTSE:

Here I have a shelf of resistance at the Fibonacci 50% level and it will require a massive show of buying power to overcome it. But if the market can somehow break this level, the likely maximum upside will be the Fibonacci 62% level around the 6,600 area.
So those are my forecasts for the early part of 2016. And if they play out, stock markets will be nicely teed up for a campaign of short selling (and long liquidation) that should last many months in a deflationary collapse.
I want to wish all my readers a Happy Christmas and prosperous New Year!
Get the latest financial news, insights and expert analysis from our award-winning MoneyWeek team, to help you understand what really matters when it comes to your finances.
John is is a British-born lapsed PhD physicist, who previously worked for Nasa on the Mars exploration team. He is a former commodity trading advisor with the US Commodities Futures Trading Commission, and worked in a boutique futures house in California in the 1980s.
He was a partner in one of the first futures newsletter advisory services, based in Washington DC, specialising in pork bellies and currencies. John is primarily a chart-reading trader, having cut his trading teeth in the days before PCs.
As well as his work in the financial world, he has launched, run and sold several 'real' businesses producing 'real' products.
-
 Japanese stocks rise on Takaichi’s snap election landslide
Japan’s new prime minister Sanae Takaichi has won a landslide victory in a snap election, prompting optimism that her pro-growth agenda will benefit Japanese stocks
-
 Alphabet 'is planning a 100-year bond': would you back Google for 100 years?
Google owner Alphabet is reported to be joining the rare century bond club