Let Fibonacci set your price targets – and trade entries
As a swing trader, you must leave your emotions at the door, says John C Burford. Fibonacci will guide you to profits.
Get the latest financial news, insights and expert analysis from our award-winning MoneyWeek team, to help you understand what really matters when it comes to your finances.
You are now subscribed
Your newsletter sign-up was successful
Want to add more newsletters?

Twice daily
MoneyWeek
Get the latest financial news, insights and expert analysis from our award-winning MoneyWeek team, to help you understand what really matters when it comes to your finances.

Four times a week
Look After My Bills
Sign up to our free money-saving newsletter, filled with the latest news and expert advice to help you find the best tips and deals for managing your bills. Start saving today!
Swing trading is a half-way house between short-term (or day) trading and long-term position trading. On average, my successful trades last anywhere from a few days to a few weeks and rarely longer than three months. It suits my personality to trade in this way. Naturally, my losing trades do not last as long.
I am a swing trader because I do not want to sit through large drawdowns while waiting for my trend to re-emerge as is often necessary when trading long-term. And who can say that the drawdown will not become permanent?
But that is not to say I will reject an opportunity to take a short-term profit within a day or so if presented, or to jump on board a longer-term position trade if I believe the waves are lining up auspiciously.
MoneyWeek
Subscribe to MoneyWeek today and get your first six magazine issues absolutely FREE

Sign up to Money Morning
Don't miss the latest investment and personal finances news, market analysis, plus money-saving tips with our free twice-daily newsletter
Don't miss the latest investment and personal finances news, market analysis, plus money-saving tips with our free twice-daily newsletter
And that is where the Fibonacci levels come in they can help pinpoint excellent areas for both the taking of profits and also the establishment of a new trade.
A short-term Fibonacci trade entry in GBP/USD
In the EUR/USD, I identified a long trade entry on Draghi Day 3 December. Although GBP/USD rallied with the euro on that day, I did not get such a definitive buy signal in 'cable' (GBP/USD). But I certainly did a few days later on 8 December.
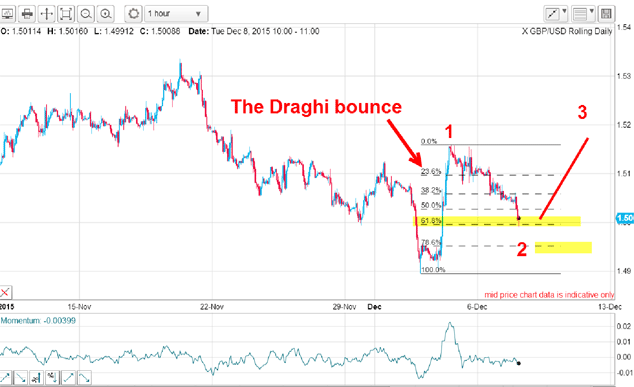
This was the hourly chart on Tuesday, 8 December:

On Tuesday, the market was retracing the large gains provided by the Draghi bounce the previous week. This is a normal reaction after a 'surprise' spike move. I placed my Fibonacci levels on that bounce and the market was then testing the Fibonacci 62% level.
If I had my Elliott wave labels correct, I have a wave 1 (or A) up and the market was finishing off the wave 2 (or B), which would end at either the 62% level or the 78% level and that latter level was my line in the sand. If the market moved below it, I would abandon my labels.
But if one of these levels held their ground, I could look forward to a third (or C) wave up and third waves are my absolute favourite waves to ride, simply because they are usually long and strong. The benefit is that in a third wave, your protective stops are in little danger of being hit, and you can rack up some impressive profits very quickly. I like that.
So a long trade at either level was indicated.
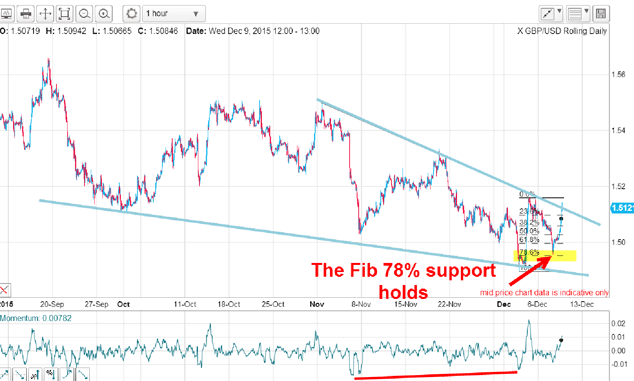
Here is the updated chart as I write on 9 December:

With the large positive-momentum divergence hinting at a sharp rally phase ahead, the Fibonacci 78% level held. And right on cue, the market rallied sharply off that support and as I write, the market is breaking up through the upper wedge line to help confirm my wave 3 (or C) label.
Isn't that pretty? And all I did was apply my Fibonacci levels on the hourly chart to find a suitable low-risk entry. And the wedge pattern should herald a substantial rally.
A profit in FTSE at a Fibonacci target
Here is a great example of how to combine the Fibonacci levels with the basic precepts of Elliott wave theory.
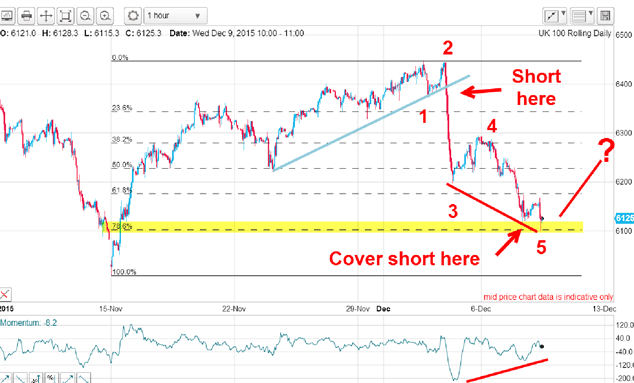
Here is the FTSE hourly chart:

I was watching the November rally and looking for a turn down. And in early December, I got the signal I was waiting for and placed a short trade just under the 6,370 level. As the market moved lower, I placed my Elliott wave labels as shown.
And when the market hit the Fibonacci 78% level (support) on my wave 5 as the momentum was diverging massively between my waves 3 and 5. That was all the information I needed to take short-term profits on my shorts at the 6,120 level for a very tasty 250 pips profit in five trading days. Not bad.
Of course, the market may continue lower, but I am not concerned I still hold a part short position (split bet strategy) I have taken an excellent short-term profit and I can always get back in later provided I get another excellent indication.
Get the latest financial news, insights and expert analysis from our award-winning MoneyWeek team, to help you understand what really matters when it comes to your finances.
John is is a British-born lapsed PhD physicist, who previously worked for Nasa on the Mars exploration team. He is a former commodity trading advisor with the US Commodities Futures Trading Commission, and worked in a boutique futures house in California in the 1980s.
He was a partner in one of the first futures newsletter advisory services, based in Washington DC, specialising in pork bellies and currencies. John is primarily a chart-reading trader, having cut his trading teeth in the days before PCs.
As well as his work in the financial world, he has launched, run and sold several 'real' businesses producing 'real' products.
-
 MoneyWeek Talks: The funds to choose in 2026
Podcast Fidelity's Tom Stevenson reveals his top three funds for 2026 for your ISA or self-invested personal pension
-
 Three companies with deep economic moats to buy now
Opinion An economic moat can underpin a company's future returns. Here, Imran Sattar, portfolio manager at Edinburgh Investment Trust, selects three stocks to buy now