How I predicted the ‘Draghi drop’
You didn't need to wait for Mario Draghi to know markets would fall, says John C Burford. Wedge patterns told you that long before.
Get the latest financial news, insights and expert analysis from our award-winning MoneyWeek team, to help you understand what really matters when it comes to your finances.
You are now subscribed
Your newsletter sign-up was successful
Want to add more newsletters?

Twice daily
MoneyWeek
Get the latest financial news, insights and expert analysis from our award-winning MoneyWeek team, to help you understand what really matters when it comes to your finances.

Four times a week
Look After My Bills
Sign up to our free money-saving newsletter, filled with the latest news and expert advice to help you find the best tips and deals for managing your bills. Start saving today!
I am away this week for a short (and much-needed) break. But I didn't want to leave you in the lurch! I wanted to remind you of some great tips I hope will help improve your trading. I will return on Wednesday 23 December with a review of what effect the Fed announcement of 16 December is having on markets.
The wedge is one of my top trade setups
So let's review what a wedge is. Some technicians call it a diagonal, but when it appears following a lengthy trend, it usually signifies a trend reversal, especially when there is a notable momentum divergence. A wedge pattern within a congestion zone is not a good predictor of anything. I only take a wedge seriously after a trend has been established for some time.
And when I see a wedge after a long trend, I automatically look out for signs of a reversal. For a trend to change, most speculators must be lined up in the direction of the old trend. After all, it is their actions that have driven the market in that direction in the first place.
MoneyWeek
Subscribe to MoneyWeek today and get your first six magazine issues absolutely FREE

Sign up to Money Morning
Don't miss the latest investment and personal finances news, market analysis, plus money-saving tips with our free twice-daily newsletter
Don't miss the latest investment and personal finances news, market analysis, plus money-saving tips with our free twice-daily newsletter
And to change that trend, those same speculators must begin exiting their positions and that is often an overwhelming force if there are enough of them (Commitments of traders (COT) data can help there).
This means that when I see a wedge pattern forming, I always refer to the sentiment picture contained in the DSI (Daily Sentiment Index) and COT data. And when it is lopsided (as it has been in the euro and gold in particular), I know I am onto something.
The Dax German stock index
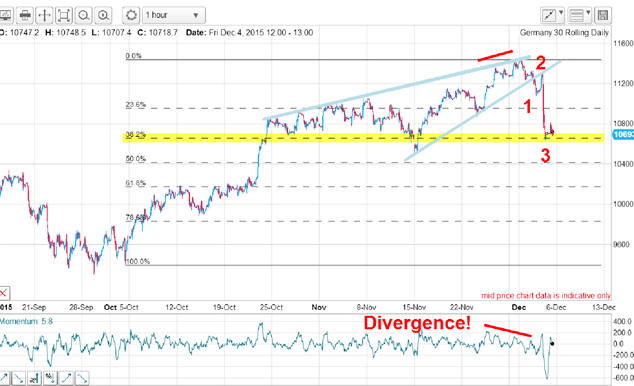
But the move was flagged beforehand by anyone who drew in the very clear wedge pattern:

This pattern came after a substantial rally, thereby qualifying it as a likely ending pattern. The market had convinced itself that Draghi was going to unleash his Big Bazooka and ran the market up to a new high on December 2, expecting a massive liquidity boost. Note the large momentum divergence into the high a sure sign the rally was running out of puff.
But surprise, surprise after the traditional wave 2 kiss on the underside of the lower wedge line, the market entered a staggering scalded-cat bounce down to the Fibonacci 38% support level within a couple of hours.
There were two terrific short trade entries the first on the lower wedge line break and an even better one on the kiss.
And this is a great example of how to set price targets following a rising wedge break. The general rule is that when the market breaks out of the wedge to the downside, the minimum price target is back to the region at the start of the wedge pattern in this case around the 10,600 area. This lies right on the Fibonacci 38% support level which the market tested.
The EUR/USD

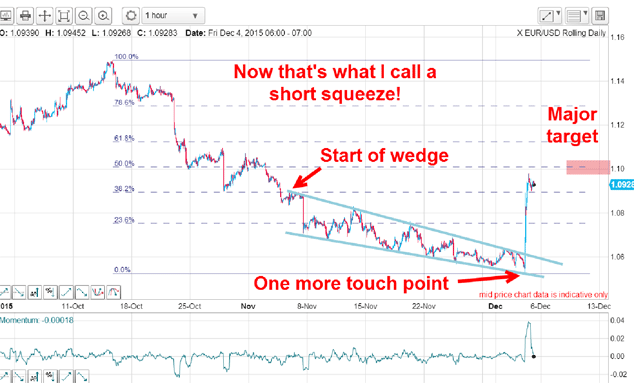
This pattern comes after a lengthy decline and so qualifies as a candidate for a trend reversal. The wedge lines are very accurate, especially the lower one which has at least eight accurate touch points. This large number is very unusual and I therefore treat it with a great deal of respect!
Combined with the extreme bearish sentiment, this was a market ripe for a major surprise. Here is the COT data as of 1 December showing the trend-following methods used by most speculators:
| (Contracts of EUR 125,000) | Row 0 - Cell 1 | Row 0 - Cell 2 | Row 0 - Cell 3 | Open interest: 582,253 | ||||
| Commitments | ||||||||
| 79,343 | 251,373 | 75,625 | 375,821 | 158,556 | 530,788 | 485,554 | 51,465 | 96,699 |
| Changes from 11/24/15 (Change in open interest: 24,274) | ||||||||
| 999 | 6,711 | 9,214 | 12,446 | 5,239 | 22,660 | 21,163 | 1,615 | 3,111 |
| Percent of open in terest for each category of traders | ||||||||
| 13.6 | 43.2 | 13.0 | 64.5 | 27.2 | 91.2 | 83.4 | 8.8 | 16.6 |
| Number of traders in each category (Total traders: 275) | ||||||||
| 65 | 124 | 79 | 58 | 67 | 168 | 227 | Row 8 - Cell 7 | Row 8 - Cell 8 |
Just before the huge spike up, hedge funds and the small speculators had added even more short bets to their already hefty pile. The result: small speculators are two to one short and large speculators are over three to one short. That is a disaster (to the bears) waiting to happen.
And at trend reversals, trend-following methods completely break down to the advantage of alert traders.
The low-risk trade was to set resting short sales just above the upper wedge line. Note that there was no kiss back to this line. If you were waiting for one, you would have missed out. Sometimes, we get a kiss and sometimes not I haven't found a simple rule that can indicate whether a kiss is likely or not.
And my minimum price target was hit almost immediately at the start of the wedge.
So look out for wedges they can offer you some very fast profits.
Get the latest financial news, insights and expert analysis from our award-winning MoneyWeek team, to help you understand what really matters when it comes to your finances.
John is is a British-born lapsed PhD physicist, who previously worked for Nasa on the Mars exploration team. He is a former commodity trading advisor with the US Commodities Futures Trading Commission, and worked in a boutique futures house in California in the 1980s.
He was a partner in one of the first futures newsletter advisory services, based in Washington DC, specialising in pork bellies and currencies. John is primarily a chart-reading trader, having cut his trading teeth in the days before PCs.
As well as his work in the financial world, he has launched, run and sold several 'real' businesses producing 'real' products.
-
 Average UK house price reaches £300,000 for first time, Halifax says
While the average house price has topped £300k, regional disparities still remain, Halifax finds.
-
 Barings Emerging Europe trust bounces back from Russia woes
Barings Emerging Europe trust has added the Middle East and Africa to its mandate, delivering a strong recovery, says Max King