Is the euro primed for a big rally?
The euro fell heavily on the news from the European Central Bank. John C Burford explains why a rally could soon be underway.
Get the latest financial news, insights and expert analysis from our award-winning MoneyWeek team, to help you understand what really matters when it comes to your finances.
You are now subscribed
Your newsletter sign-up was successful
Want to add more newsletters?

Twice daily
MoneyWeek
Get the latest financial news, insights and expert analysis from our award-winning MoneyWeek team, to help you understand what really matters when it comes to your finances.

Four times a week
Look After My Bills
Sign up to our free money-saving newsletter, filled with the latest news and expert advice to help you find the best tips and deals for managing your bills. Start saving today!
Last Friday, after Mario Draghi dragged the euro lower, I noted the delicate position the euro was in after the massive 200-pip collapse on Thursday.
And this morning, it is the turn of GBP/USD to be dragged down (the Salmond effect?). But as the pound is off by more than 150 pips as I write, the euro is holding its own, so far.
Today, I want to reiterate why the Thursday low in EUR/USD is a significant support level despite what the pound is doing.
MoneyWeek
Subscribe to MoneyWeek today and get your first six magazine issues absolutely FREE

Sign up to Money Morning
Don't miss the latest investment and personal finances news, market analysis, plus money-saving tips with our free twice-daily newsletter
Don't miss the latest investment and personal finances news, market analysis, plus money-saving tips with our free twice-daily newsletter
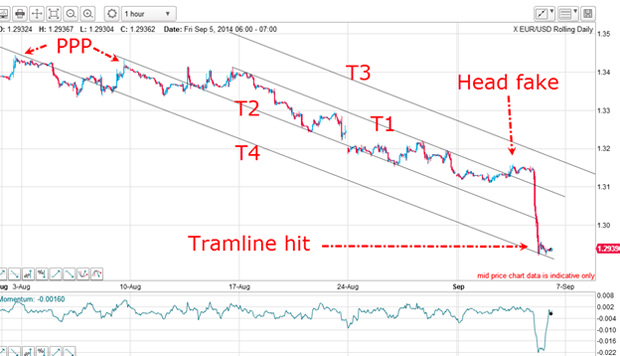
On Friday, I noted that the market had declined to the 1.29 area, which lay on my short-term T4 tramline:

That tramline is a support area. But if I may, there are a few other reasons why 1.29 was a major support area.
The 'golden mean' pointed the way
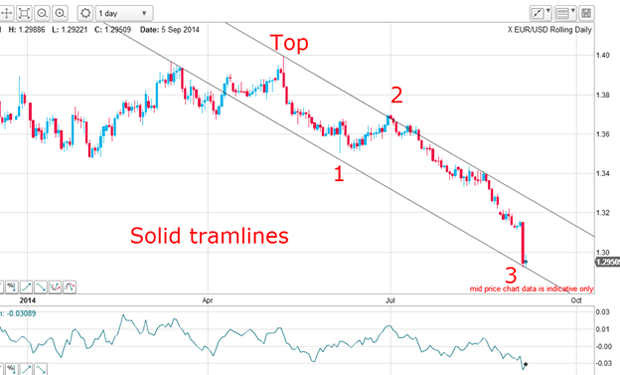
This is the daily chart showing the 1.40 top in May:

I have a very good tramline pair stretching back to March, with the lower tramline sporting an excellent prior pivot point (PPP). The market has declined to the lower tramline in wave 3. That is another line of support.
Not only that, but if I apply the common relationship wave 3 = 1.618 times wave 1, I get a target of 1.2907 for wave 3 low. The Thursday low was 1.920 only 13 pips adrift.
Considering the freefall nature of Thursday's decline, that is a direct hit in my book.
Isn't that remarkable? The market knows' the Fibonacci golden mean ratio of 1.618 is a very significant number and governs many wave relationships relating the high and low extremes. How did the market know when to stop collapsing right at the 1.618 multiple of wave 1?
Of course, as traders we can use this knowledge to set our price targets and pay our respects to Sr Fibonacci at the same time as we take profits.
Now, I have three separate reasons to believe the 1.29 area is major support from two independent tramline sets and one Fibonacci wave ratio. In a way, the 1.39 area represents triple-strong support.
The odds now favour the 1.29 level is the wave 3 low and now we can expect a wave 4 rally.
Watch out for 'the right hook'
On Friday, I noted that sentiment was heavily euro bearish. This is what I wrote on Friday:
"So now this morning, we are left with the intriguing position that the heavily lop-sided bearish euro sentiment has undoubtedly become even more bearish with yesterday's action. Earlier in the week the DSI (Daily Sentiment Index) had declined to less than 10%, which is an extreme last seen in May 2010 over four years ago. This morning, that figure will surely be even lower".
And on Friday, DSI bull sentiment had indeed declined further to a lowly 4%, which extreme matched the July 2013 reading, which occurred just prior to a massive euro rally.
Will history repeat? If it does, it will go against the overwhelming majority opinion. Most are convinced the European Central Bank (ECB) will continue to succeed in driving the euro lower. I am not.
And if my analysis is correct, my first target for wave 4 will be the 1.31 1.32 area on the upper tramline in the above chart.
And how long will wave 4 likely take to complete before wave 5 down starts? In Elliott wave theory, there is a concept I call "the right look".
To be a valid wave count, waves should be in rough proportion to each other. Here, wave 1 lasted around20trading days. I expect wave 4 to last at least a major fraction of that twenty days (around four calendar weeks).
And if I do get my wave 4 rally, a big short squeeze will be on!
Get the latest financial news, insights and expert analysis from our award-winning MoneyWeek team, to help you understand what really matters when it comes to your finances.
John is is a British-born lapsed PhD physicist, who previously worked for Nasa on the Mars exploration team. He is a former commodity trading advisor with the US Commodities Futures Trading Commission, and worked in a boutique futures house in California in the 1980s.
He was a partner in one of the first futures newsletter advisory services, based in Washington DC, specialising in pork bellies and currencies. John is primarily a chart-reading trader, having cut his trading teeth in the days before PCs.
As well as his work in the financial world, he has launched, run and sold several 'real' businesses producing 'real' products.
-
 ISA fund and trust picks for every type of investor – which could work for you?
Whether you’re an ISA investor seeking reliable returns, looking to add a bit more risk to your portfolio or are new to investing, MoneyWeek asked the experts for funds and investment trusts you could consider in 2026
-
 The most popular fund sectors of 2025 as investor outflows continue
It was another difficult year for fund inflows but there are signs that investors are returning to the financial markets