Is gold about to confirm its double top?
After gold's recent high, it is now trading nicely down John C Burford's tramlines and is reaching a crucial support level. Could this be confirmation of gold's double top?
Get the latest financial news, insights and expert analysis from our award-winning MoneyWeek team, to help you understand what really matters when it comes to your finances.
You are now subscribed
Your newsletter sign-up was successful
Want to add more newsletters?

Twice daily
MoneyWeek
Get the latest financial news, insights and expert analysis from our award-winning MoneyWeek team, to help you understand what really matters when it comes to your finances.

Four times a week
Look After My Bills
Sign up to our free money-saving newsletter, filled with the latest news and expert advice to help you find the best tips and deals for managing your bills. Start saving today!
With yesterday's market-moving announcements from the US Federal Reserve and the Bank of England now out of the way, I am spoiled for choice between the Dow (down), the euro (down) and gold (down).
Today, I will look at gold.
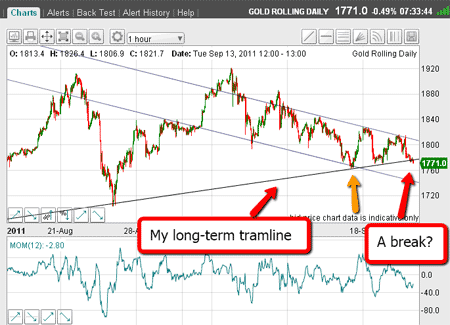
When I left gold last Friday, the market had declined off my second top at $1,920 to my long-term tramline at the $1,760 area. I showed that the market then was toying with my tramline.
MoneyWeek
Subscribe to MoneyWeek today and get your first six magazine issues absolutely FREE

Sign up to Money Morning
Don't miss the latest investment and personal finances news, market analysis, plus money-saving tips with our free twice-daily newsletter
Don't miss the latest investment and personal finances news, market analysis, plus money-saving tips with our free twice-daily newsletter
Since then, the market rallied, but to an important tramline.
The markets are saying QE will no longer work
Yesterday afternoon, before the Fed announcement, gold was holding at the $1,800 area, but fell heavily when the news was released.
This morning, the market is right back to my long-term tramline. Here is the updated chart:

(Click on the chart for a larger version)
Normally, the weakening stock market would help support gold (with investors in 'flight to safety' mode), but it is telling that all markets fell in unison.
I had been expecting this, since very broadly and for some time, asset markets have been moved up and down by the waves of liquidity entering and exiting the system. As liquidity increased, asset markets have risen, and vice versa. That was the whole point of quantitative easing (QE) to support asset markets. But now the markets are telling us that this policy will no longer work.
One other technical point is this: as losses mount at hedge funds and other institutions, they will be receiving margin calls (their brokers demanding more cash basically). To meet them they will have to lighten up on their profitable positions. The last remaining long positions that they hold are in gold.
On the chart above, I have noted with a yellow arrow the point where my long-term tramline crosses over my lower down-sloping tramline, which I will cover a bit later.
Trader tip: When you see two tramlines from different angles meet, that usually indicates very strong support (or resistance). On the occasions that the market slices right through this crossing, that indicates the trend is very strong.
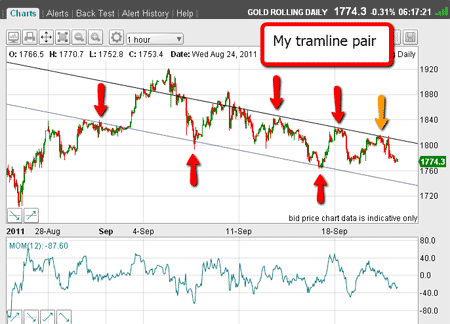
OK, now I am ready to re-draw my tramlines off the recent $1,920 high:

(Click on the chart for a larger version)
On Monday, I was able to draw these tramlines because I had some very good touch-points (marked by red arrows). So when the market rallied to yesterday's high (yellow arrow), it met the upper tramline perfectly.
If you need to learn more on how I use my tramline system, take a look at my video tutorial: An introduction to tramline trading.
Trader tip: Use your tramlines to forecast where rallies and dips will probably turn around. That means, draw them into your charts as soon as you can identify them and keep them there!
A break of support would be compelling evidence for gold's 'double top'
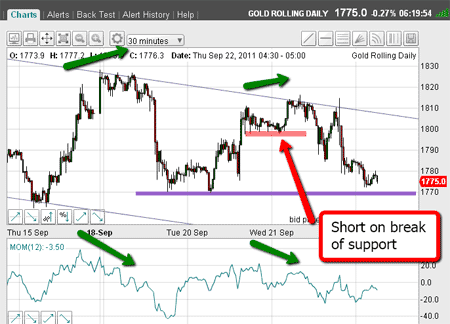
Now let's get a close-up of recent action:

(Click on the chart for a larger version)
Before the Fed's announcement, the market had broken my mini support level as marked by the pink bar.
That is where I placed my short trade. My stop was placed at $1,820, following my 3% rule.
I was happy to see the negative momentum divergence at this rally high (marked by green arrows you can see that on each occasion, momentum had already peaked, even as the price went higher), as it indicated a weakening of the rally.
Note the identical situation at the previous rally high. History can repeat!
But following the announcement, the market spiked up, but could not make a new high, and then in a very fast market, spiked right back down again.
Incidentally, I was unable to place any trades on my spread betting platform in this period: the volume of orders simply overloaded the system as the markets were crashing. Sadly, there is nothing you can do in this situation.
The second place to short although much riskier is under the purple bar at the $1,770 area.
My first target is, of course, the lower tramline at the $1,730 area.
And if the $1,700 level can be breached, that would make my double top theory compelling.
PS Have a look at my introductory videos for beginners
If you're a new reader, or need a reminder about some of the methods I refer to in my trades, then do have a look at my introductory videos:
Tramlines: An introduction to tramline trading
Elliott waves: An introduction to Elliott wave theory
Fibonacci: Trading with Fibonacci levels
Don't miss my next trading insight. To receive all my spread betting blog posts by email, as soon as I've written them, just sign up here .
Get the latest financial news, insights and expert analysis from our award-winning MoneyWeek team, to help you understand what really matters when it comes to your finances.
John is is a British-born lapsed PhD physicist, who previously worked for Nasa on the Mars exploration team. He is a former commodity trading advisor with the US Commodities Futures Trading Commission, and worked in a boutique futures house in California in the 1980s.
He was a partner in one of the first futures newsletter advisory services, based in Washington DC, specialising in pork bellies and currencies. John is primarily a chart-reading trader, having cut his trading teeth in the days before PCs.
As well as his work in the financial world, he has launched, run and sold several 'real' businesses producing 'real' products.
-
 Average UK house price reaches £300,000 for first time, Halifax says
While the average house price has topped £300k, regional disparities still remain, Halifax finds.
-
 Barings Emerging Europe trust bounces back from Russia woes
Barings Emerging Europe trust has added the Middle East and Africa to its mandate, delivering a strong recovery, says Max King