You are now subscribed
Your newsletter sign-up was successful
Want to add more newsletters?

Twice daily
MoneyWeek
Get the latest financial news, insights and expert analysis from our award-winning MoneyWeek team, to help you understand what really matters when it comes to your finances.

Four times a week
Look After My Bills
Sign up to our free money-saving newsletter, filled with the latest news and expert advice to help you find the best tips and deals for managing your bills. Start saving today!
For many years since 1990 in fact Japanese stock markets have been hugely disappointing for UK investors. No sooner has the market seemed poised for a major upturn when the cold winds of deflation have come rushing down to extinguish the bullish flames.
I well remember the real estate bubble where Tokyo commercial property prices topped London and Manhattan and the business district valuations exceeded all of California's!
MoneyWeek
Subscribe to MoneyWeek today and get your first six magazine issues absolutely FREE

Sign up to Money Morning
Don't miss the latest investment and personal finances news, market analysis, plus money-saving tips with our free twice-daily newsletter
Don't miss the latest investment and personal finances news, market analysis, plus money-saving tips with our free twice-daily newsletter
And when they famously paid well over the top for van Gogh's Chrysanthemums' painting a symbol of death, notably that marked the top.
Naturally, the good times were too good to last, and the bubble burst in 1990 as shown in the Nikkei chart:
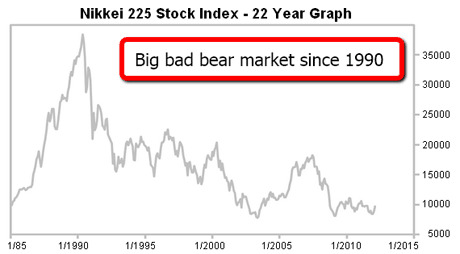
(Click on the chart for a larger version)
The market made its historic high above the 35,000 level and has been in a 22-year bear market ever since and is currently trading near its post-bubble lows surrounding 10,000.
From the basic principle that investors should be buying low and selling high, the question is: Is 10,000 low enough to consider investing now?
My colleague James Ferguson has recently made a well-researched case for believing that prospects for a big bull market appear sound. At the same time, James made the important point that currency conversions for UK investors has always made investing in Japan very precarious.
In the past, whenever stocks rallied, the gains for UK investors were often reduced or even wiped out by adverse currency moves, and in recent years, the yen has seen some huge swings. I may cover the yen in a later post.
But with bullish consensus in the US stock markets running high following a massive rally off the October lows many are now thinking the Japan markets are poised similarly for take-off.
So let's examine the charts to find clues as to the state of play:
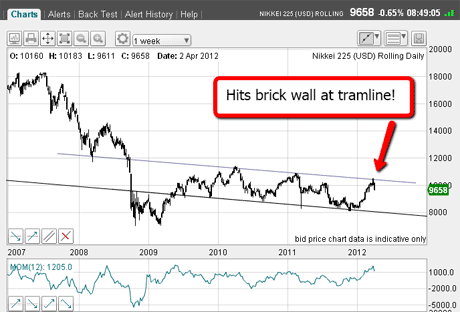
(Click on the chart for a larger version)
The Nikkei topped out in 2007 in concert with all major markets and has been struggling to rise from the ashes. I have drawn in a terrific tramline pair that takes in many major highs and lows. These are very long-term tramlines and I consider them very sound.
World stock indexes reach large round-numbers together
Bullish excitement has been ramped up by the move above the 10,000 level. This precisely mirrored the same reaction as has accompanied the Dow attaining 13,000, the S&P 14,000, the FTSE 6,000, and the DAX 7,000 all at the same time!
What an amazing coincidence for all indexes to reach such large round-figures at the same time.
But the latest Nikkei rally above 10,000 has hit a brick wall right at my upper three and a half-year tramline. That is impressive. Anyone having this knowledge and trading Japanese shares would know what to do at least lighten up on longs or even go short, as I will show.
Here is the daily chart with my long-term tramlines in place:
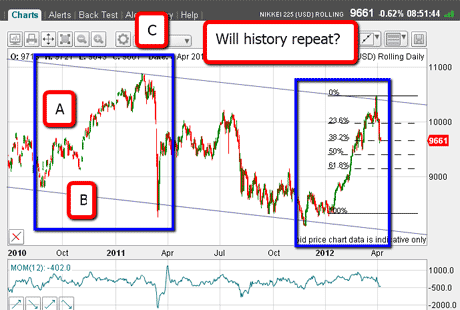
(Click on the chart for a larger version)
I have drawn the left-hand blue box surrounding trading off the September low to the February high. Note the A-B-C pattern (counter-trend) to the rally to the upper tramline.
Now see the plunge off the C wave high right back down to the lower tramline a move of around 2,500 points (25%) in a few days. That is a massive and rapid fall.
Now look at the right-hand blue box and note the similarities. We have had a rally off the lower tramline in an A-B-C form to the recent high on the upper tramline.
Since hitting the 10,480 high on 30 March, the market has been sharply rebuffed by the tramline and as of this morning has declined almost 1,000 points in only a few trading days. It is looking very much like a repeat of the earlier pattern.
It appears the decline is matching that in the previous period, so far. If so, my projected target is the lower tramline in the 8,000 area.
But the comparison would end if the market can push above the tramline. In this event, the odds would very much shift to a bull move.
It's nearly time to buy Japanese shares
Because most world stock markets move roughly in synch, can we gather any clues from the action in US or UK markets?
On 28 March, I showed that the FTSE is vulnerable to large declines, and on 2 April, I noted that Barclays a bellwether share was also likely on the verge of large declines. I have short positions in both.
And then, on Good Friday, the US released some truly shocking jobs data that will do little to bolster confidence in the US economic recovery' or add to stock market bullishness, which has lately been in feverish mode.
Incidentally, I find it noteworthy that this shock' data point was released on a public holiday when very few traders were at their desks. Futures markets were open and reacted immediately, but then closed shortly thereafter.
In a rare occurrence, traders have a whole weekend to digest the news, and since stock markets are heavily overweight to the long side, the odds for big rallies are not high.
It is likely, then, that my lower target for the Nikkei is entirely realistic.
At some stage, buying Japanese shares because they are cheap will be a no-brainer. But possibly not yet.
I hope you can see how my tramline methods can help guide your investment timings as well as in your swing trading spread-betting. It is truly a valuable resource for me.
If you're a new reader, or need a reminder about some of the methods I refer to in my trades, then do have a look at my introductory videos:
The essentials of tramline trading
An introduction to Elliott wave theory
Advanced trading with Elliott waves
Don't miss my next trading insight. To receive all my spread betting blog posts by email, as soon as I've written them, just sign up here .
-
 ISA fund and trust picks for every type of investor – which could work for you?
Whether you’re an ISA investor seeking reliable returns, looking to add a bit more risk to your portfolio or are new to investing, MoneyWeek asked the experts for funds and investment trusts you could consider in 2026
-
 The most popular fund sectors of 2025 as investor outflows continue
It was another difficult year for fund inflows but there are signs that investors are returning to the financial markets

