I’m getting ready for a break-out in the euro
John C Burford went bullish on the euro in January. And his target's now been reached. So what should traders do now?
Get the latest financial news, insights and expert analysis from our award-winning MoneyWeek team, to help you understand what really matters when it comes to your finances.
You are now subscribed
Your newsletter sign-up was successful
Want to add more newsletters?

Twice daily
MoneyWeek
Get the latest financial news, insights and expert analysis from our award-winning MoneyWeek team, to help you understand what really matters when it comes to your finances.

Four times a week
Look After My Bills
Sign up to our free money-saving newsletter, filled with the latest news and expert advice to help you find the best tips and deals for managing your bills. Start saving today!
Today, I'll show you how my tramlines are pointing to a break-out in the euro. The question is, which way: up or down? Let's take a look
When I last covered the EUR/USD on 27 January the market had a nice-looking Elliott five-wave pattern to the rally off the 16 January low.
This rally had carried to my long-standing 1.32 target and I expected at least a pause.
MoneyWeek
Subscribe to MoneyWeek today and get your first six magazine issues absolutely FREE

Sign up to Money Morning
Don't miss the latest investment and personal finances news, market analysis, plus money-saving tips with our free twice-daily newsletter
Don't miss the latest investment and personal finances news, market analysis, plus money-saving tips with our free twice-daily newsletter
I wrote: "So, if my labels are correct, I can expect a decline, at least to the lower tramline in a probable A-B-C pattern. We already have a budding A and B wave forming as I write".
And that is what occurred, but in slightly altered form. The market did back off from the 1.32 area. Then, in a three-wave dip, it declined to the 1.30 region where it found support. It's currently challenging the 1.32 area again, as you'll see in today's charts.
How you can profit from crowd behaviour
Recall that I turned bullish on the euro in early January. At the time, almost everyone was predicting its death. Bearish sentiment was off the scale following intense publicity of the eurozone crises (plural).
This is a vivid example of herding. I showed how a nimble trader, who is able to stand outside the hysteria, can benefit from this crowd behaviour.
Back then, I had an initial target of 1.32 in mind. So now we are there, which way will the market go? That's what I want to look at today.
Actually, the market has been consolidating recently with no clear short-term direction.
But I have a chart that I believe will astonish you.
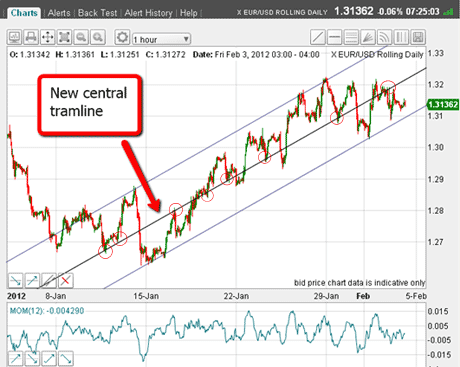
First, because of the recent consolidation between 1.30 and 1.32, I have a new set of tramlines for the rally phase:

(Click on the chart for a larger version)
I drew the lowest one across the two major lows. Then I added a parallel line to take in the highs.
Once those two were in place, I drew a central tramline mid-way between them. Right away you can see that it covers several of the minor highs and lows since 11 January. I've marked these with circles.
I believe I can still use these lines to guide my trading.
Now, let's look at a longer-range chart and this is the fascinating one.
This chart points to a coming euro break-out

(Click on the chart for a larger version)
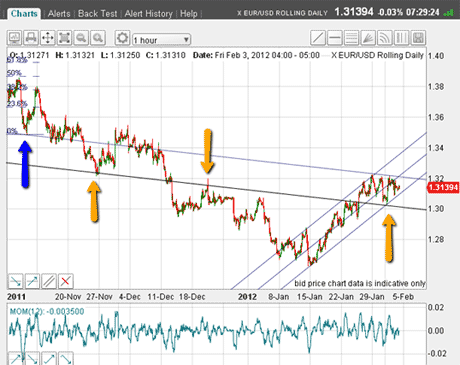
From last November, I can draw a line starting from the low marked by the blue arrow and taking in the recent highs near 1.32.
Then I add a parallel line underneath that, which takes in the recent 1.30 low.
See how this lower line passes right through the significant low made on 27 November, marked by the left-hand yellow arrow. Isn't that pretty?
It also takes in the significant high marked by the central yellow arrow! That's nice.
These tramlines also are still operating, I believe.
Now I have two sets of tramlines at work. That means that any break out of either of them should be very significant.
That break could come soon, as the tramline sets diverge up ahead.
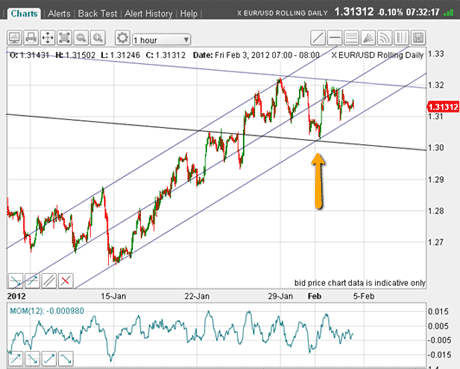
Here is a close-up showing the two tramline sets:

(Click on the chart for a larger version)
The recent 1.30 low is marked by the yellow arrow.
Now let's zoom in a bit with this slightly closer-range chart
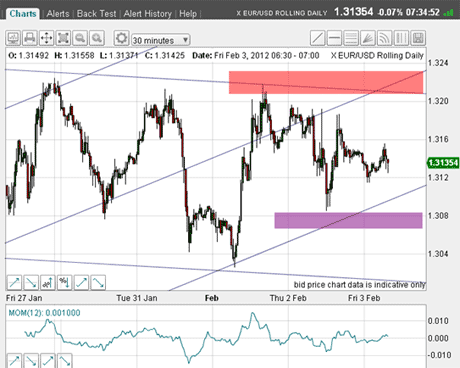
Where I'm looking for a move up or down

(Click on the chart for a larger version)
I have marked the zones where I could place orders to take advantage of a break-out, either up or down.
At this stage, I cannot say with confidence which way it will go up or down. But I'm sure the matter will be resolved very shortly.
Because the market (speculators) remains very short, the odds may favour an upside resolution as of this morning.
So perhaps my 1.36 second target is not so fanciful, after all. As I said before, that would put the cat amongst the pigeons alright!
By the way, I made a short video about how I use tramlines to find entry points for trades. If you haven't seen it, you can watch it here: The essentials of tramline trading.
If you're a new reader, or need a reminder about some of the methods I refer to in my trades, then do have a look at my introductory videos:
The essentials of tramline trading
An introduction to Elliott wave theory
Advanced trading with Elliott waves
Don't miss my next trading insight. To receive all my spread betting blog posts by email, as soon as I've written them, just sign up here .
Get the latest financial news, insights and expert analysis from our award-winning MoneyWeek team, to help you understand what really matters when it comes to your finances.
John is is a British-born lapsed PhD physicist, who previously worked for Nasa on the Mars exploration team. He is a former commodity trading advisor with the US Commodities Futures Trading Commission, and worked in a boutique futures house in California in the 1980s.
He was a partner in one of the first futures newsletter advisory services, based in Washington DC, specialising in pork bellies and currencies. John is primarily a chart-reading trader, having cut his trading teeth in the days before PCs.
As well as his work in the financial world, he has launched, run and sold several 'real' businesses producing 'real' products.
-
 Food and drinks giants seek an image makeover
The global food and drink industry is having to change pace to retain its famous appeal for defensive investors. Who will be the winners?
-
 Britain is still suffering from Tony Blair's terrible legacy
Here are ten ways in which Tony Blair's government sowed the seeds of Britain’s subsequent poor performance and many of its current problems, says Max King