I need one more signal to confirm a euro rally
The euro is currently searching for a low – and has just hit a vital target, says John C Burford.. Could this be the start of a major relief rally?
Get the latest financial news, insights and expert analysis from our award-winning MoneyWeek team, to help you understand what really matters when it comes to your finances.
You are now subscribed
Your newsletter sign-up was successful
Want to add more newsletters?

Twice daily
MoneyWeek
Get the latest financial news, insights and expert analysis from our award-winning MoneyWeek team, to help you understand what really matters when it comes to your finances.

Four times a week
Look After My Bills
Sign up to our free money-saving newsletter, filled with the latest news and expert advice to help you find the best tips and deals for managing your bills. Start saving today!
I last covered the EUR/USD on 9 November and today I thought I would follow up on its progress, because it has hit one of my targets this morning.
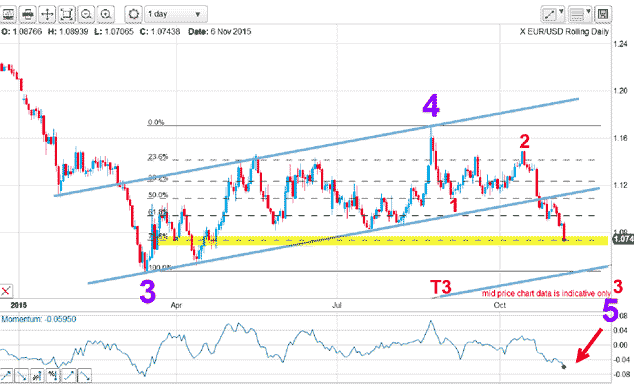
Below is the daily chart I left you with last time. My centre tramline had been broken, and that set my target at the T3 support line. Naturally, the precise level of my target would depend on how fast or how slow the descent to it would be and sadly, that was out of my hands! This problem is especially acute when dealing with highly sloping tramlines where the difference between a few days along T3 can be tens of pips.

But here, I had moderately-sloping tramlines and I was reasonably confident I could set my target in the 1.06 1.07 zone. Today we'll see how far the market is away from that target.
MoneyWeek
Subscribe to MoneyWeek today and get your first six magazine issues absolutely FREE

Sign up to Money Morning
Don't miss the latest investment and personal finances news, market analysis, plus money-saving tips with our free twice-daily newsletter
Don't miss the latest investment and personal finances news, market analysis, plus money-saving tips with our free twice-daily newsletter
Hedge funds are shorting the euro and they're almost always wrong eventually
If Draghi's programme is successful and that is a very big 'if' that would enable heavily indebted companies to inflate away their debt load in the traditional manner. An extended period of deflation, of course, would put huge pressure on them.
In any case, the last time Draghi uttered that vow, the market took the euro on a severe bear trend with heavy selling by hedge funds. Will lightning strike twice? Hedge funds evidently think so. In the latest week, hedgies (the non-commercials) increased their bearish bets and are now holding three times as many shorts and longs. The market is now heavily short and could be ripe for a counter-trend rally to shake out the latest shorts in a squeeze. Here is the latest Commitments of Traders data:
| CONTRACTS OF €125,000 | Open interest: 549,229 | |||||||
| Commitments | ||||||||
| 81,112 | 237,693 | 65,891 | 351,414 | 151,970 | 498,418 | 455,554 | 50,812 | 93,676 |
| Changes from 10/11/15 (Change in open interest: 24,174) | ||||||||
| -258 | 17,913 | 6,631 | 15,403 | -863 | 21,777 | 23,681 | 2,397 | 493 |
| Percent of open interest for each category of traders | ||||||||
| 14.8 | 43.3 | 12.0 | 64.0 | 27.7 | 90.7 | 82.9 | 9.3 | 17.1 |
| Number of traders in each category (Total traders: 269) | ||||||||
| 60 | 122 | 70 | 58 | 64 | 158 | 215 | Row 8 - Cell 7 | Row 8 - Cell 8 |

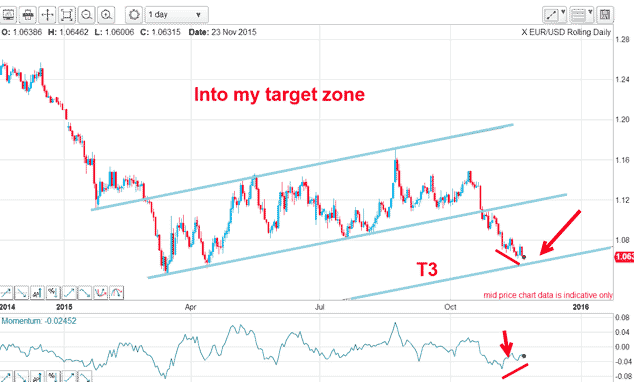
The low this morning is 1.0602, and has hit the lower edge of my target zone. Nice.
But can I make a case for a decent rally from here? I have a budding positive momentum divergence and if it holds, its strength indicates the snap-back rally could be vigorous.
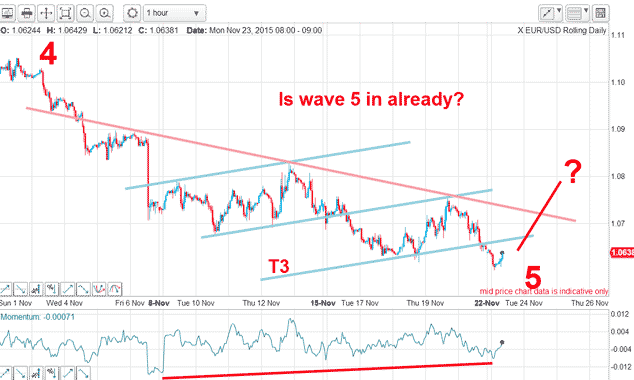
On the hourly chart , I have a very good tramline trio in blue (this is not the same as that on the daily) and the market has broken T3 and is now pulling back to try for at least a kiss.
But what if the market catches a bid and pushes on past T3 and up towards my pink trendline? This line of resistance has multiple accurate touch points and I can use it as my line in the sand. If the market moves above it, the line switches to become support.

Then, it would undoubtedly encounter masses of protective buy stops placed there by the bears and light a fuse to rocket the market higher in a 'surprise' rally that would have the media in a tizzy trying to 'explain' it.
One slight problem with this scenario is that the 1.0460 March low has not yet been broken, which would make the wave labels look better. I cannot rule out this break just yet.
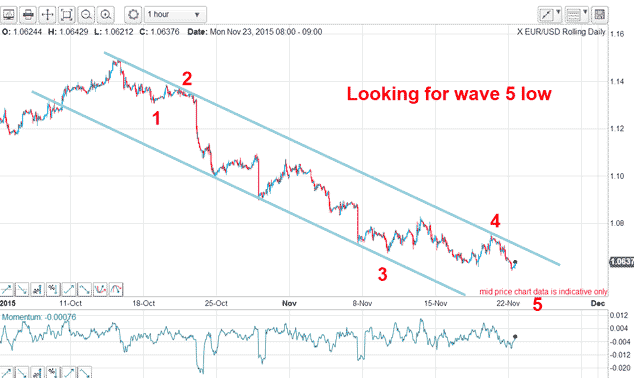
But I also have excellent tramlines on the wave down off the October high:

That is a valid wave count the market is currently searching for the wave 5 low. A break above my upper blue tramline would help confirm a decent rally is underway. But whether it is the start of a major relief rally of several hundreds of pips, we shall have to wait and see.
Get the latest financial news, insights and expert analysis from our award-winning MoneyWeek team, to help you understand what really matters when it comes to your finances.
John is is a British-born lapsed PhD physicist, who previously worked for Nasa on the Mars exploration team. He is a former commodity trading advisor with the US Commodities Futures Trading Commission, and worked in a boutique futures house in California in the 1980s.
He was a partner in one of the first futures newsletter advisory services, based in Washington DC, specialising in pork bellies and currencies. John is primarily a chart-reading trader, having cut his trading teeth in the days before PCs.
As well as his work in the financial world, he has launched, run and sold several 'real' businesses producing 'real' products.
-
 Last chance to invest in VCTs? Here's what you need to know
Investors have pumped millions more into Venture Capital Trusts (VCTS) so far this tax year, but time is running out to take advantage of tax perks from them.
-
 ISA quiz: How much do you know about the tax wrapper?
Quiz One of the most efficient ways to keep your savings or investments free from tax is by putting them in an Individual Savings Account (ISA). How much do you know about ISAs?