How to trade the Canadian dollar
The exchange rate between the Canadian and US dollars is one of the most watched. John C Burford explains how he latched on to a long-term trade.
Get the latest financial news, insights and expert analysis from our award-winning MoneyWeek team, to help you understand what really matters when it comes to your finances.
You are now subscribed
Your newsletter sign-up was successful
Want to add more newsletters?

Twice daily
MoneyWeek
Get the latest financial news, insights and expert analysis from our award-winning MoneyWeek team, to help you understand what really matters when it comes to your finances.

Four times a week
Look After My Bills
Sign up to our free money-saving newsletter, filled with the latest news and expert advice to help you find the best tips and deals for managing your bills. Start saving today!
As a one-time resident of Canada, I well remember the anguish many Canadians felt about the dollar exchange rate and they still do. This is because most Canadians live very close to the US border and visit the States frequently.
Not only that, but there is massive cross-border trade, which is sensitive to the exchange rate. US imports into Canada become more expensive as the Canadian dollar weakens.
Historically, this rate displays very wide swings and is a wonderful market to trade, especially for long-term moves. Once a trend gets under way, it can last for months and years, as is typical in currency markets.
MoneyWeek
Subscribe to MoneyWeek today and get your first six magazine issues absolutely FREE

Sign up to Money Morning
Don't miss the latest investment and personal finances news, market analysis, plus money-saving tips with our free twice-daily newsletter
Don't miss the latest investment and personal finances news, market analysis, plus money-saving tips with our free twice-daily newsletter
So today, I will describe how I latched on to a long-term (for me!) trade.
Be a contrarian but get your timing right
The USD/CAD trade was one of my Trades for 2014' and was based on my forecast for a much stronger US dollar this year, and a mini-forecast that oil prices would be under pressure (along with the general commodity complex).
Naturally, these were deeply unpopular views at the time. I figured that the USD/CAD rate would improve over the year as these forces did their work.
Recall that early in 2014, the US dollar was despised with EUR/USD rising to 1.40 in May (which turned out to be a major top).
There were concerns about the US budget deficit, the rising national debt, and of course, the ongoing Fed's quantitative easing (QE) money printing which was devaluing' the dollar.
The Canadian central bank refrained from QE operations, so the obvious trade was to short USD/CAD.
This was yet another example of how, by adhering to the logical story, a trader would have been badly hurt. Back then, there were precious few dollar bulls.
But that is precisely the time when smart traders look to take the opposite stance and look for reasons to go against conventional thinking.
Today, the boot is on the other foot with crashing oil prices hurting the Canadian dollar and the rapidly improving US Federal budget aiding the US dollar.
One day, this story will become so widely accepted that it will be wrong and the market will head back down. That's how markets work in a nutshell.
You do not need a dogmatic view: all you need is an open mind and when sentiment becomes too lop-sided either bullish or bearish that is usually the best time to strike. Be a contrarian but get your timing right!
Why this is one of my most wanted trades'
Here is the weekly chart:
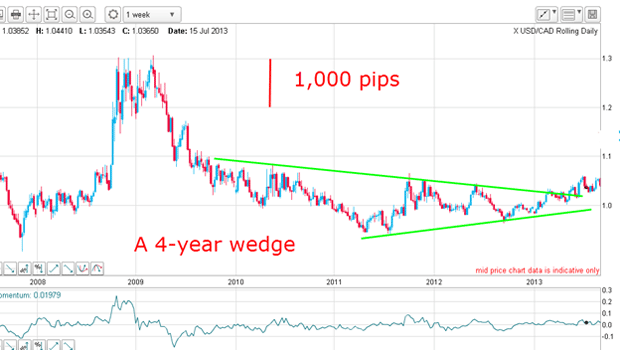
During the height of the credit crunch, the flight to the US dollar in 2008 resulted in the USD/CAD to zoom up to the 1.30 level. Since then, it fell back and formed a pretty clear multi-year wedge from 2009 to 2013.
An upward break of this wedge in early 2013 was the signal that the market wanted to burst out of the straight-jacket of the wedge and move higher. Remember, this would have been against the prevailing opinion.
As I noted in the monthly chart of Alcoa last year, a break out of a multi-year wedge promises a long and strong move of many months duration. That was the juicy prospect that I saw and decided to put it high up on my most wanted trades'.
How the USD/CAD trade has played out
Actually, I picked up the USD/CAD trade earlier this year and this was the daily chart then:
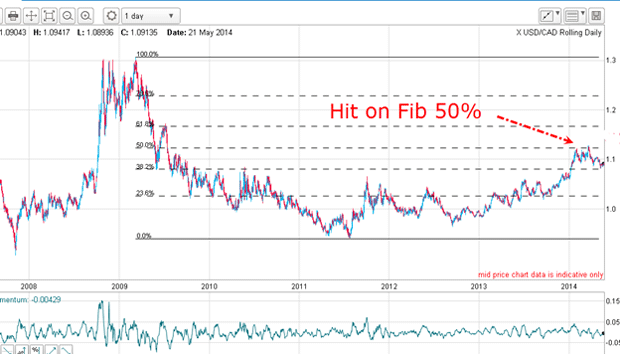
As I suspected, the market was moving higher out of the wedge. But was this a good place to enter a long trade?
Because it had made a solid hit on the Fibonacci 50% retrace of the entire 20092011 swing, I decided to wait for a better low-risk opportunity and I did not have to wait long:
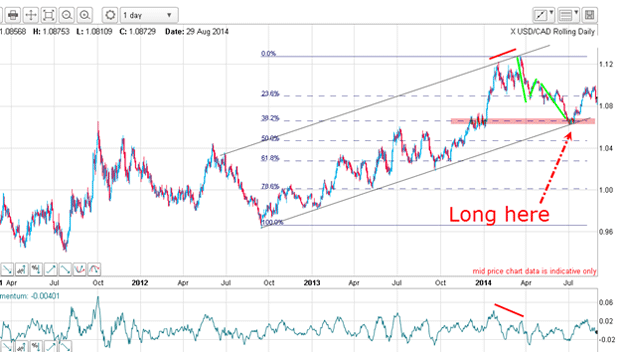
The March high was made on a strongly negative-momentum divergence, which told me the 50% level was likely to lead to a large counter-trend decline.
Then in July, the market had made a nice A-B-C right to the lower tramline, which contained several accurate touch points. And that was a Fibonacci 38% retrace of the wave up from the major 2012 low, which is a support level.
What more did I need? That was about as clear a setup as I have seen and I decided to go long there in the 107.50 area.
Here is the updated weekly chart:
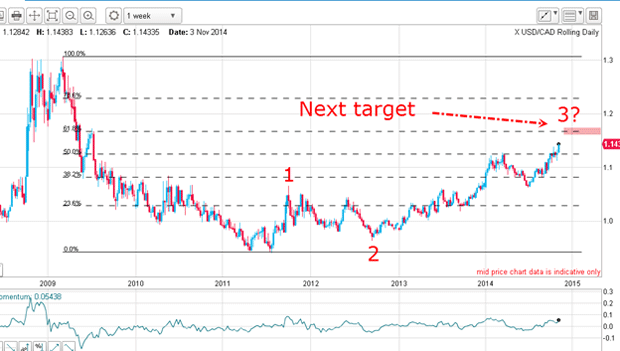
The current move has all the hallmarks of a third wave and the market is heading for my next major target at the Fibonacci 62% level in the 1.16 area.
Why I'm confident the market will hit my target
But what does the shorter-term picture look like? Here is the daily:
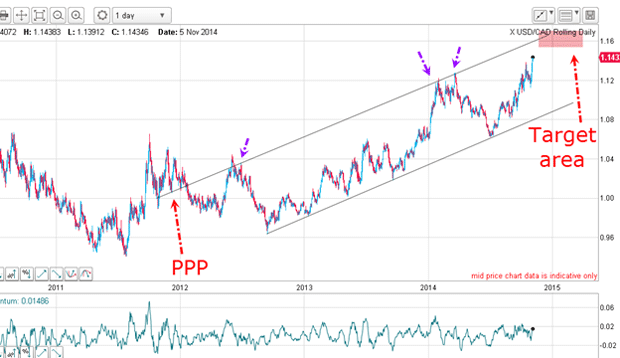
I have my excellent lower tramline, but the upper line is decidedly inferior. It does have a good PPP (prior pivot point) and three accurate touch points (purple arrows), but the overshoot is bothersome. It is the best fit here, though.
Interestingly, if the market makes it to this upper tramline, it will hit it in the 1.161.17 area; precisely the level of the Fibonacci 62% target.
So now I have two independent methods telling me that a major target is in this area. And because the market made a very accurate hit on the Fibonacci 50% level in early 2014, I have confidence that the market has a high probability of hitting the 62% level.
We shall see.
Get the latest financial news, insights and expert analysis from our award-winning MoneyWeek team, to help you understand what really matters when it comes to your finances.
John is is a British-born lapsed PhD physicist, who previously worked for Nasa on the Mars exploration team. He is a former commodity trading advisor with the US Commodities Futures Trading Commission, and worked in a boutique futures house in California in the 1980s.
He was a partner in one of the first futures newsletter advisory services, based in Washington DC, specialising in pork bellies and currencies. John is primarily a chart-reading trader, having cut his trading teeth in the days before PCs.
As well as his work in the financial world, he has launched, run and sold several 'real' businesses producing 'real' products.
-
 Average UK house price reaches £300,000 for first time, Halifax says
While the average house price has topped £300k, regional disparities still remain, Halifax finds.
-
 Barings Emerging Europe trust bounces back from Russia woes
Barings Emerging Europe trust has added the Middle East and Africa to its mandate, delivering a strong recovery, says Max King