How to stalk a low-risk trade in the charts
Use these chart-trading methods to line up the best low-risk trades, says John C Burford. Then pull the trigger.
Get the latest financial news, insights and expert analysis from our award-winning MoneyWeek team, to help you understand what really matters when it comes to your finances.
You are now subscribed
Your newsletter sign-up was successful
Want to add more newsletters?

Twice daily
MoneyWeek
Get the latest financial news, insights and expert analysis from our award-winning MoneyWeek team, to help you understand what really matters when it comes to your finances.

Four times a week
Look After My Bills
Sign up to our free money-saving newsletter, filled with the latest news and expert advice to help you find the best tips and deals for managing your bills. Start saving today!
Which trades should you put your money on, and which should you ignore?
Too many traders get an idea for a trade based on reading a bullish or bearish article from one of their favourite pundits, or finding a trend already in place on their charts, or even waking up one day and feeling like making a trade. I call that throwing darts while blindfolded' trading.
Consequently, they have no sense in timing the trade. There is no profit in buying at the top of a move or selling at the bottom, as so many traders do. As in most things, timing is critical to success.
MoneyWeek
Subscribe to MoneyWeek today and get your first six magazine issues absolutely FREE

Sign up to Money Morning
Don't miss the latest investment and personal finances news, market analysis, plus money-saving tips with our free twice-daily newsletter
Don't miss the latest investment and personal finances news, market analysis, plus money-saving tips with our free twice-daily newsletter
No, every trade I make must carry with it a sensible close protective stop within my 3% rule, and if I can find a stop allowing for maximum loss of less than 3%, so much the better. And it must offer a decent prospective return compared with the risk in other words, a high reward/risk ratio.
That means I stalk my trades until I am presented with such a low-risk opportunity. But the crucial point is this: if I cannot find such a low-risk entry, I leave it alone until I do.
This means that I often miss moves as I have in the great bull market in the stock indexes. But I don't lose any sleep over this I have other great set-ups to work on. And one of these is the GBP/USD market, which is an ongoing trade.
Because I concentrate on risk before anything else, I always work out what my maximum loss would be before placing the trade. And that is why working with tramlines and Fibonacci ratios is so valuable.
They afford specific price levels where your analysis is likely to be wrong and a signal to abandon the trade. There is no better information a swing trader can have.
Too many traders see how it goes' if their trade isn't working, and they usually take a larger loss than they would if they had a specific stop-loss in place.
With your tramlines and accurate Fibonacci levels marked on your chart, you can see at a glance where you should be placing your stops within a narrow band of prices.
Stalking the US dollar
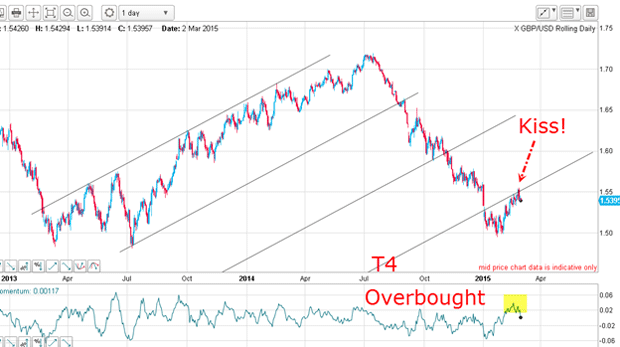
The rally was heading for the underside of my fourth tramline (marked T4 on the chart) and last week, it made the hit. That kiss was the alert I needed to actively look for a short trade, especially with momentum in overbought territory (highlighted in yellow on the chart). The relief rally should be ending very soon.
As I was preparing for a trade, this is the hourly chart I showed last Wednesday:
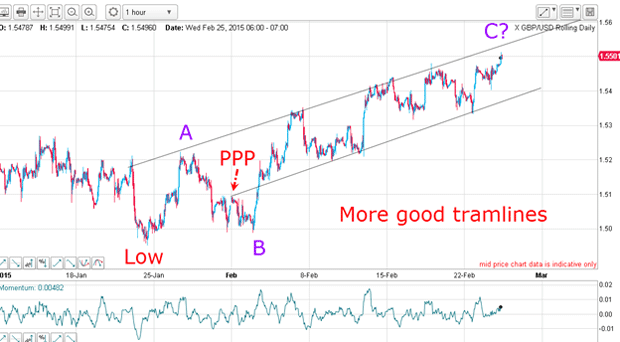
I was getting close to pulling the trigger! The market has heading for the C wave top and the upper tramline with a potential momentum divergence on the cards. My finger was poised on the sell button.
And I didn't have to wait long after Wednesday's post. On Thursday, the market made a pretty accurate hit on the upper tramline and I got my short trade off near the top. My stop was placed just above the day's high:
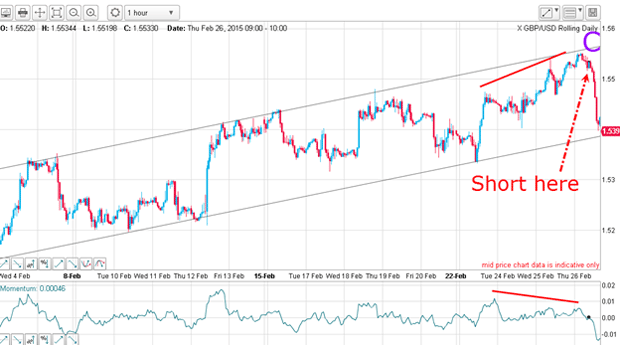
As a bonus, I got my negative-momentum divergence, adding to my confidence in the trade.
Now the trade is in profit (and my stop moved to break even, of course), can I confirm the trend is now down, or is this just a small dip before it zooms higher again? After all, the uninformed will tell you never to trade against the trend.
For this, I need to go to the 15-minute chart for clarity:
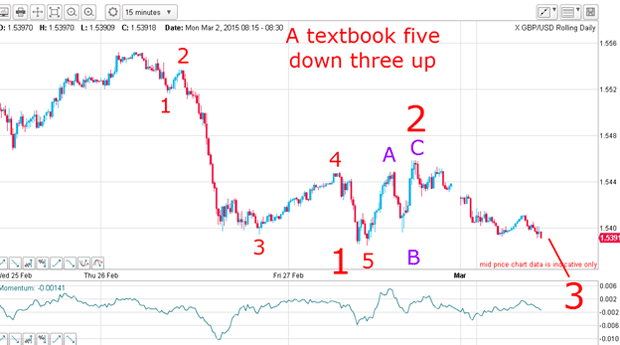
Sure enough, the move off Thursday's high is in a beautiful five down three up, confirming with high probability the trend is now down. With the market breaking into new lows this morning, we should be in a third wave down.
So how does this fit into the bigger picture? Here is the current daily chart again:
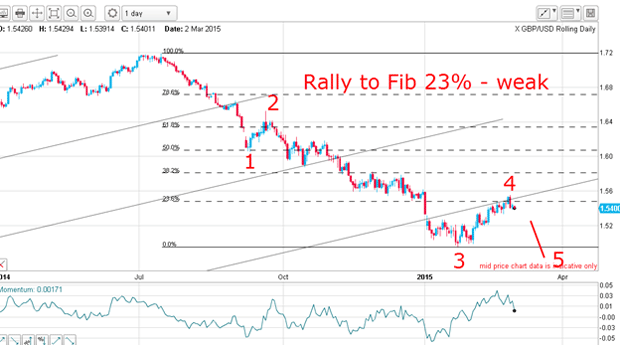
If last week's rally high holds which only managed a weak Fibonacci 23% recovery we are in Elliott wave number 3 of 5 which could take the market to new lows below the 1.50 level.
Whether this trade works or not, I have my stop at break even, thus ensuring a no loss trade and that is a comforting feeling for any trader.
In summary, I stalked the trade, waited for the right moment, evaluated my reward/risk ratio, pulled the trigger and waited for the market to confirm my forecast. When satisfied, I moved my stop-loss to break even.
If you follow this same disciplined pattern, you will avoid the Hail Mary' thoughts we all get, and become a true professional.
Get the latest financial news, insights and expert analysis from our award-winning MoneyWeek team, to help you understand what really matters when it comes to your finances.
John is is a British-born lapsed PhD physicist, who previously worked for Nasa on the Mars exploration team. He is a former commodity trading advisor with the US Commodities Futures Trading Commission, and worked in a boutique futures house in California in the 1980s.
He was a partner in one of the first futures newsletter advisory services, based in Washington DC, specialising in pork bellies and currencies. John is primarily a chart-reading trader, having cut his trading teeth in the days before PCs.
As well as his work in the financial world, he has launched, run and sold several 'real' businesses producing 'real' products.
-
 MoneyWeek Talks: The funds to choose in 2026
Podcast Fidelity's Tom Stevenson reveals his top three funds for 2026 for your ISA or self-invested personal pension
-
 Three companies with deep economic moats to buy now
Opinion An economic moat can underpin a company's future returns. Here, Imran Sattar, portfolio manager at Edinburgh Investment Trust, selects three stocks to buy now