How to pinpoint a turn in the gold price
The lack of headlines in the media suggests the rally in gold is here to stay, says spread betting expert John C Burford.
Get the latest financial news, insights and expert analysis from our award-winning MoneyWeek team, to help you understand what really matters when it comes to your finances.
You are now subscribed
Your newsletter sign-up was successful
Want to add more newsletters?

Twice daily
MoneyWeek
Get the latest financial news, insights and expert analysis from our award-winning MoneyWeek team, to help you understand what really matters when it comes to your finances.

Four times a week
Look After My Bills
Sign up to our free money-saving newsletter, filled with the latest news and expert advice to help you find the best tips and deals for managing your bills. Start saving today!
The rapid rise in gold prices has attracted surprisingly little mediaattention and that suggests the rally is not likely to peter out anytime soon. Maybe that is because there is no obvious story (unless you are a technical analyst, that is). It is when I see garish headlines proclaiming "gold is back" that I begin to worry.
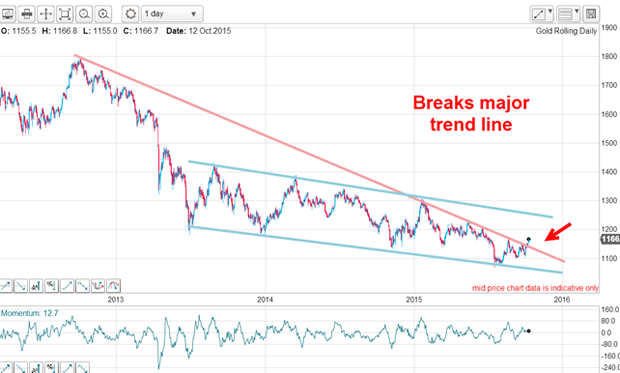
On Monday, I showed a long-range chart on which the market had just broken above the multi-year trendline (a bullish signal). The chart also showed the blue tramline pair I have been using as a guide:

Following the trendline break, the upper tramline became my main target (but not necessarily my final one). That target lies in the $1,200-plus area.
MoneyWeek
Subscribe to MoneyWeek today and get your first six magazine issues absolutely FREE

Sign up to Money Morning
Don't miss the latest investment and personal finances news, market analysis, plus money-saving tips with our free twice-daily newsletter
Don't miss the latest investment and personal finances news, market analysis, plus money-saving tips with our free twice-daily newsletter
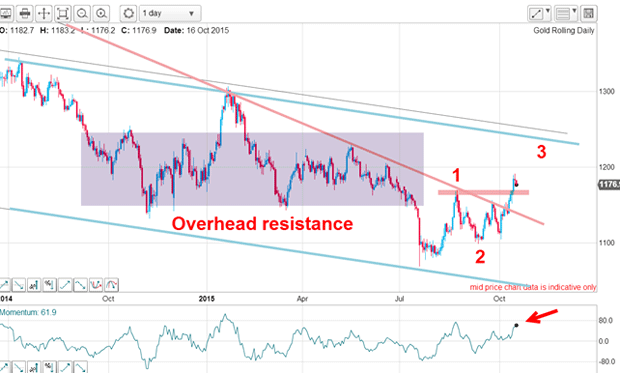
So, how does that chart look today? The market has risen this week by about $40 to yesterday's high at the $1,191 print. It is thus confirming my Elliott wave labels. I am working under the assumption that we are in a third of a third up. And another confirmation is the move above the wave 1 high that was the action I was looking for. But now the market is encountering overhead resistance and it is formidable. I have highlighted the zone and this is an area where there was a lot of trading over a long period.

There will be many disappointed shorts from that zone who have seen the sharp rally in recent weeks. Their target of sub-$1,000 is getting further away, not getting closer. Ouch!
Many of those shorts will be buying back (covering) their short trades and thus adding to the pressure for higher prices.
There will also be many longs from that zone who realised they got in too early and have seen the market plunge in the summer, creating big losses. Some will be taking this opportunity to exit their positions by selling into the rally and take a much-reduced loss with a great sigh of relief. They may see this rally as a bear market rally and a heaven-sent gift to extricate themselves.
When a trading congestion zone such as this one is created, the longer it persists, the greater the number of winners and losers coming out of it and the greater the volatility it produces.
That is why overhead resistance zones usually present many hurdles for the rally to overcome. And that is what I expect now we are roughly half way into the zone with few setbacks so far.
In other words, I expect to see pull-backs and this morning we have one on progress.

If I can determine where a pull-back will turn, I will have an opportunity to enter a low-risk trade.
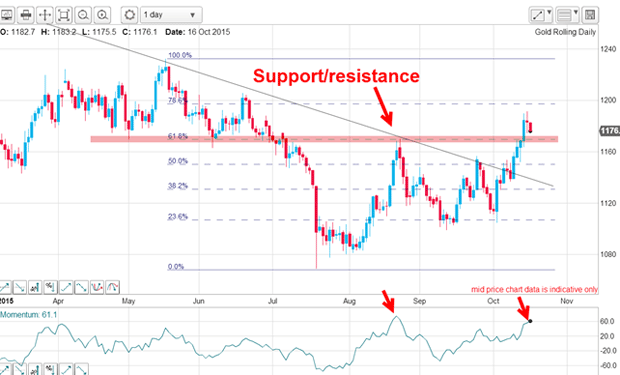
I have drawn in a purple line. Before July, it was a line of support where declines to it were repulsed. After July, it became a line of resistance with the major August high also being turned away.
But on Wednesday, the market punched through the resistance and the line is now a line of support again. If it remains true to type, the current pull-back should turn at or above this line.
This is what I wrote on Monday: "The move above the August high has helped confirm my original wave count we are now in a third of a third. This is a most powerful set-up and we are seeing fireworks well before 5 November."
I have no reason to change my outlook for early fireworks.
Get the latest financial news, insights and expert analysis from our award-winning MoneyWeek team, to help you understand what really matters when it comes to your finances.
John is is a British-born lapsed PhD physicist, who previously worked for Nasa on the Mars exploration team. He is a former commodity trading advisor with the US Commodities Futures Trading Commission, and worked in a boutique futures house in California in the 1980s.
He was a partner in one of the first futures newsletter advisory services, based in Washington DC, specialising in pork bellies and currencies. John is primarily a chart-reading trader, having cut his trading teeth in the days before PCs.
As well as his work in the financial world, he has launched, run and sold several 'real' businesses producing 'real' products.
-
 ISA fund and trust picks for every type of investor – which could work for you?
Whether you’re an ISA investor seeking reliable returns, looking to add a bit more risk to your portfolio or are new to investing, MoneyWeek asked the experts for funds and investment trusts you could consider in 2026
-
 The most popular fund sectors of 2025 as investor outflows continue
It was another difficult year for fund inflows but there are signs that investors are returning to the financial markets