Gold is turning – this is how to profit
John C Burford examines trading sentiment data to see where the gold price is heading to next.
Get the latest financial news, insights and expert analysis from our award-winning MoneyWeek team, to help you understand what really matters when it comes to your finances.
You are now subscribed
Your newsletter sign-up was successful
Want to add more newsletters?

Twice daily
MoneyWeek
Get the latest financial news, insights and expert analysis from our award-winning MoneyWeek team, to help you understand what really matters when it comes to your finances.

Four times a week
Look After My Bills
Sign up to our free money-saving newsletter, filled with the latest news and expert advice to help you find the best tips and deals for managing your bills. Start saving today!
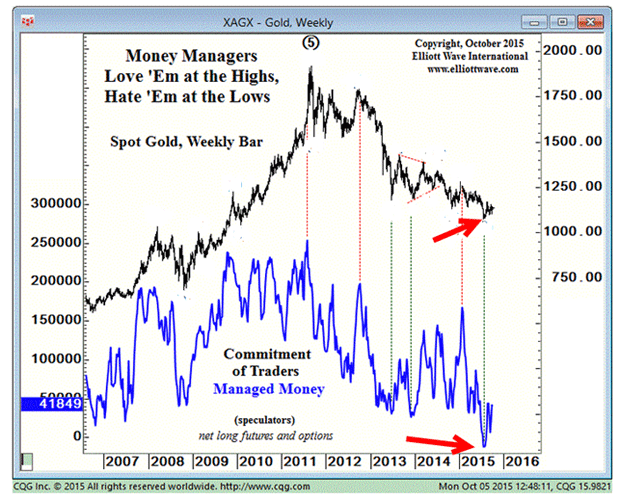
On Friday I wrote about gold, and how hedge funds are at their most committed at major market turns. The eye-opening multi-year chart below shows the net long/short position of hedge funds compared with the gold price. Note that in every case, major highs and lows correspond almost exactly with lows/highs of the net long position, as highlighted by the dashed vertical lines.

The all-time high in 2011 was marked by an all-time high in net long positions. This is when the hedge funds were at their most committed ever but should have been in exactly the opposite stance if they wanted to maximise profits.
Conversely, at the July plunge low, hedge funds were actually net short a situation I believe was unprecedented. Given the large army of extremely loyal always-long gold bugs (who believe in the metal no matter what the price is doing), and the fact that the gold trade (who are always on the other side of the hedge funds' futures long positions) are usually hedging their mine production by selling futures forward, this is a staggering development.
MoneyWeek
Subscribe to MoneyWeek today and get your first six magazine issues absolutely FREE

Sign up to Money Morning
Don't miss the latest investment and personal finances news, market analysis, plus money-saving tips with our free twice-daily newsletter
Don't miss the latest investment and personal finances news, market analysis, plus money-saving tips with our free twice-daily newsletter
This demonstrates the extreme bearish sentiment in the market in the summer and proves the accuracy of the title: "They love 'em at the highs, hate 'em at the lows".
The market's changing its mind on gold
So with the market having moved up in recent days, what is the current position? For that information, we turn to the latest commitment of traders (COT) data,which shows changes to the futures make-up during the previous week. Here is Friday's data which refers to Tuesday, 6 October:
| (Contracts of 100 troy ounces) | Row 0 - Cell 1 | Row 0 - Cell 2 | Row 0 - Cell 3 | Open interest: 625,986 | ||||
| Commitments | ||||||||
| 193,998 | 101,178 | 165,405 | 229,316 | 324,351 | 588,719 | 590,934 | 37,267 | 35,053 |
| Changes from 09/29/15 (Change in open interest: 25,896) | ||||||||
| 9,620 | -4,454 | 13,392 | 1,478 | 20,752 | 24,490 | 29,691 | 1,406 | -3,795 |
| Percent of open in terest for each category of traders | ||||||||
| 31.0 | 16.2 | 26.4 | 36.6 | 51.8 | 94.0 | 94.4 | 6.0 | 5.6 |
| Number of traders in each category (Total traders: 373) | ||||||||
| 163 | 128 | 133 | 59 | 63 | 287 | 266 | Row 8 - Cell 7 | Row 8 - Cell 8 |
Clearly, the speculators have increased their long trades while decreasing their short ones. The trade (commercials) have taken the other side of these trades and increased their hedging activities into the rallies. This is a clear sign that the speculators are switching sides and are gradually buying into the bullish case.
Of course, if this keeps up and the buying pressure can dominate, the market will rise to a point where the speculators are overwhelmingly long and that will be a sign the rally is about to turn. But that day is some way off, I believe. First, I need to see headlines in the mediasuch as "Goldman Sachs targets $2,500 gold", or "Gold production down 35% this year", or "China's central bank buys 25,000 tons of gold".
The mechanics of a turning market
The attitude of the commercials is directly opposite to that of a bearish short-selling speculator who certainly wants to drive the market immediately lower as low as possible, in fact.
That makes a huge difference to the shape of gold bull phases. Commercials who hedge are not normally interested in covering their shorts in the futures market they deliver gold on their contracts when they mature. On the other hand, speculative shorts, who never want to touch the stuff, always have to cover their shorts before their contracts come due, and are therefore a source of buying pressure down the line.
That dynamic is one reason gold bull markets can often carry on much higher than most expect and can carry an unusually high degree of net long speculative positions before they turn.
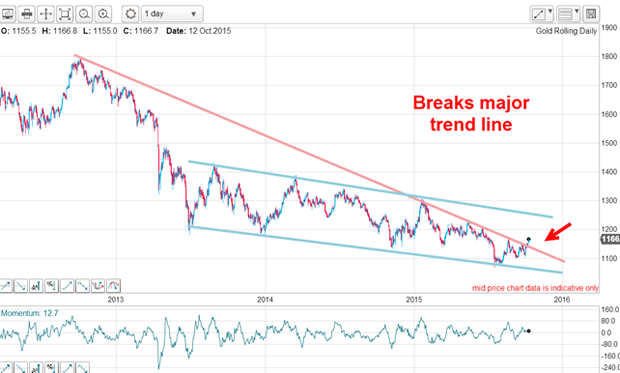
This morning, the market has jumped above the $1,250 level and above my major (pink) trendline which starts in 2012:

I also have a valid tramline pair marked in blue. This trendline break is a bullish development.
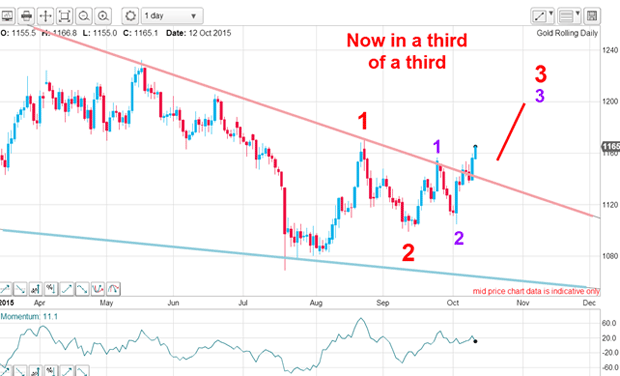
Here is a close-up:

The move above the August high has helped confirm my original wave count we are now in a third of a third. This is a most powerful set-up and we are seeing fireworks well before 5 November!
Get the latest financial news, insights and expert analysis from our award-winning MoneyWeek team, to help you understand what really matters when it comes to your finances.
John is is a British-born lapsed PhD physicist, who previously worked for Nasa on the Mars exploration team. He is a former commodity trading advisor with the US Commodities Futures Trading Commission, and worked in a boutique futures house in California in the 1980s.
He was a partner in one of the first futures newsletter advisory services, based in Washington DC, specialising in pork bellies and currencies. John is primarily a chart-reading trader, having cut his trading teeth in the days before PCs.
As well as his work in the financial world, he has launched, run and sold several 'real' businesses producing 'real' products.
-
 Can mining stocks deliver golden gains?
With gold and silver prices having outperformed the stock markets last year, mining stocks can be an effective, if volatile, means of gaining exposure
-
 8 ways the ‘sandwich generation’ can protect wealth
People squeezed between caring for ageing parents and adult children or younger grandchildren – known as the ‘sandwich generation’ – are at risk of neglecting their own financial planning. Here’s how to protect yourself and your loved ones’ wealth.