How to make hay in the Dow Jones
The rapid decline in the Dow will have caught many investors off-guard, says John C Burford. But it was written in the charts all along.
Get the latest financial news, insights and expert analysis from our award-winning MoneyWeek team, to help you understand what really matters when it comes to your finances.
You are now subscribed
Your newsletter sign-up was successful
Want to add more newsletters?

Twice daily
MoneyWeek
Get the latest financial news, insights and expert analysis from our award-winning MoneyWeek team, to help you understand what really matters when it comes to your finances.

Four times a week
Look After My Bills
Sign up to our free money-saving newsletter, filled with the latest news and expert advice to help you find the best tips and deals for managing your bills. Start saving today!
On Friday, the title of my post was "Is it time to take profits in the Dow?" I was referring to my trade where I had sold the Dow short very near the top above the 16,400 area on 21 January.
Based on my analysis, I was looking for a big plunge immediately from that area. You can review all of my posts around that date for details.
The title also could have been construed to ask whether cashing out of shares and taking profits was a good policy. And that reading would have been appropriate as well.
MoneyWeek
Subscribe to MoneyWeek today and get your first six magazine issues absolutely FREE

Sign up to Money Morning
Don't miss the latest investment and personal finances news, market analysis, plus money-saving tips with our free twice-daily newsletter
Don't miss the latest investment and personal finances news, market analysis, plus money-saving tips with our free twice-daily newsletter
Many are calling this a normal and expected' correction. But my view remains completely different. I actually wonder what a normal' correction looks like. In all of my years trading, I have yet to see one until after the event, of course.
Also, if the pundits expected' it, why didn't they warn us the Dow was about to decline by over 7% in a fortnight? I didn't read a single comment calling for an immediate and large move down. And that might have actually been useful.
Complacency is running rampant
Now, I am not saying this to puff my chest out because I managed to pick the top. My point is that the vast majority of pundits are saying this savage 7% Dow decline is OK no worries. The US economy is bouncing back and even with the Fed taper in operation, company earnings will grow, so buy the dips here - what an opportunity!
As a continuation of the 2013 scenario, complacency among the pundits is running rampant. This is perfectly understandable. Who wants to ditch a strategy (buying the dips) that has worked so spectacularly well for several years?
But as the market declines further, more investors will be questioning this approach. It will take time to unravel and this selling will be the fuel for the markets to work lower and lower.
Listen to the markets, not the experts
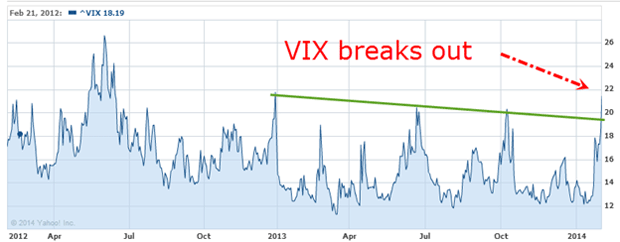
Source: Yahoo Finance
This rapid ascent is flashing warning signs that fear levels are increasing and that complacency is being swept away in a brutal wake-up call.
One of the most important indicators to judge when a market is bombed out and poised for a large relief rally is to scan the titles of current articles. This week, I see very few mentions of the word panic'. The overwhelming opinion is that this correction can be contained and is simply a healthy blip on the way to new highs later this year.
Meanwhile, as a swing trader, I have taken over 1,000 pips out of a short trade in two weeks.
Incidentally, the Dow is back to where it was in May of last year. So basically, the Dow has made zero progress in eight months. If I had bought the Dow in mid-May and sold near the top last month, I would have made the same profit that I have just made in two weeks on my short trade.
I also would have had to suffer some big draw-downs on that long trade. On the other hand, my short trade was virtually straight down, with small relief rallies. Believe me when I say that was easy on the stress levels.
So, that's why I prefer trading share indexes from the short side. I hope you can see why today's post is titled "How to make hay in the Dow Jones".
The charts don't lie
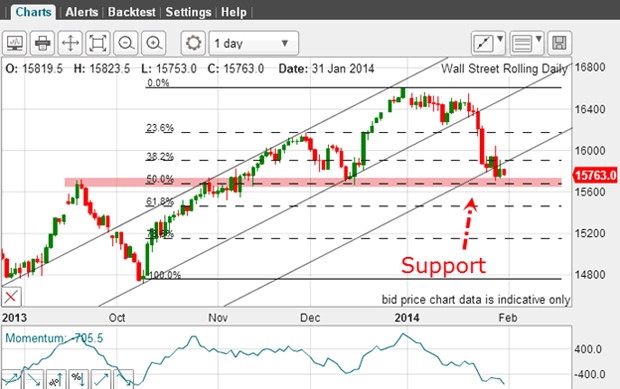
This was the daily chart last time showing the critical support zone that was in danger of giving way:
And give way it did. Here is the current chart:
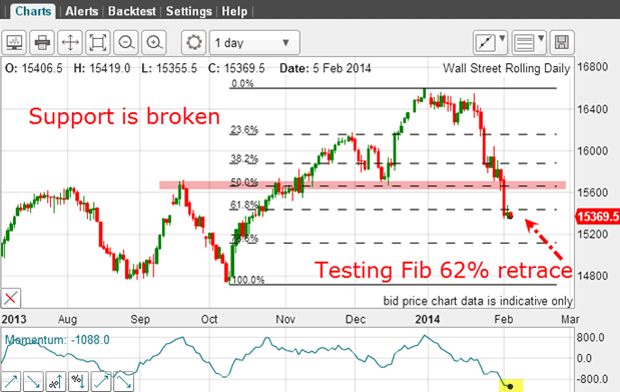
The selling was strong enough to break support. The market is currently testing the Fibonacci 62% level. Momentum is way oversold, and so the question arises whether a relief rally is due very soon.
For any clues, I turn to the hourly chart:
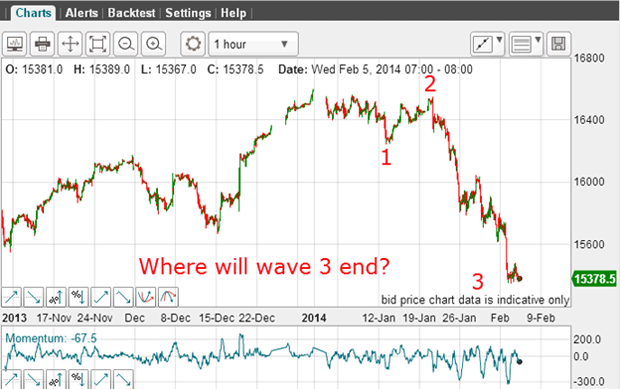
We are clearly in a long and very strong wave 3. As I write, it shows no sign of ending. So no clues there.
Let's zoom in on that third wave. If I can make a clear five sub-wave count within it, I can anticipate a possible ending:
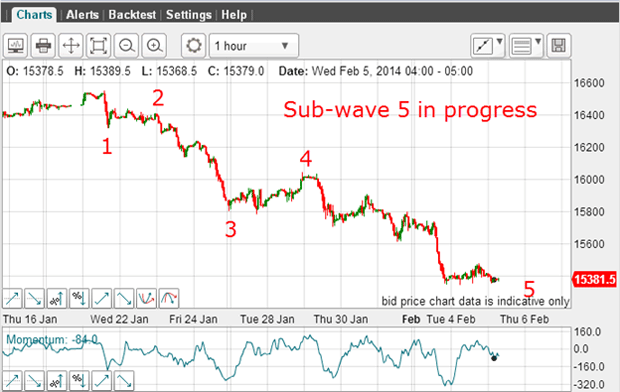
This is my Elliot-wave (EW) count of this third wave. The extended fifth sub-wave is an unusual feature. When I see this, I always look for five sub-sub-waves within it. If I can see a collection of fifth waves bunching up, I know that a very large relief rally could likely begin soon.
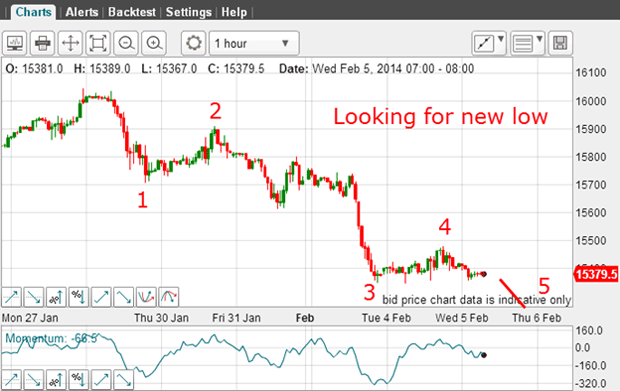
This is my count of that fifth wave. To complete the pattern, I need to see a new low in this smaller fifth wave preferably on a large positive-momentum divergence. If this occurs, that will give me two fifth waves at the end of the large third wave.
This final fifth wave could occur on a spike move down. That will signal to me that the relief rally can get under way and to cover shorts.
Short-sellers are finally in their element
From a swing-trading perspective, I am happy taking partial profits of over 1,000 pips here and holding the remainder. There is always the chance the rally can start from here and I do not want to see my terrific profits vanish!
There is no doubt that this rapid and sharp global stock-market decline has caught many investors off-guard. They will be very nervous and jumpy. Short-sellers are finally in their element.
Get the latest financial news, insights and expert analysis from our award-winning MoneyWeek team, to help you understand what really matters when it comes to your finances.
John is is a British-born lapsed PhD physicist, who previously worked for Nasa on the Mars exploration team. He is a former commodity trading advisor with the US Commodities Futures Trading Commission, and worked in a boutique futures house in California in the 1980s.
He was a partner in one of the first futures newsletter advisory services, based in Washington DC, specialising in pork bellies and currencies. John is primarily a chart-reading trader, having cut his trading teeth in the days before PCs.
As well as his work in the financial world, he has launched, run and sold several 'real' businesses producing 'real' products.
-
 MoneyWeek Talks: The funds to choose in 2026
Podcast Fidelity's Tom Stevenson reveals his top three funds for 2026 for your ISA or self-invested personal pension
-
 Three companies with deep economic moats to buy now
Opinion An economic moat can underpin a company's future returns. Here, Imran Sattar, portfolio manager at Edinburgh Investment Trust, selects three stocks to buy now