Aussie v US dollar: how to handle a losing trade
Many traders would turn away from a market that handed them a losing trade, says John C Burford. But that would often be a big mistake.
Get the latest financial news, insights and expert analysis from our award-winning MoneyWeek team, to help you understand what really matters when it comes to your finances.
You are now subscribed
Your newsletter sign-up was successful
Want to add more newsletters?

Twice daily
MoneyWeek
Get the latest financial news, insights and expert analysis from our award-winning MoneyWeek team, to help you understand what really matters when it comes to your finances.

Four times a week
Look After My Bills
Sign up to our free money-saving newsletter, filled with the latest news and expert advice to help you find the best tips and deals for managing your bills. Start saving today!
The tramline kiss is one of my favourite chart patterns. It offers superb low-risk trading opportunities in the direction of the prevailing trend.
In my posts of 21 and 23 July, I showed several great examples, and in one of them, I had the AUS/USD chart, which was the one failure that I documented.
Today, I want to follow up on that market to illustrate the general point that you can often turn a trade failure into potential winners. Many traders would turn away from a market that handed them a losing trade, but that would be a big mistake in many cases. Don't trade emotionally!
MoneyWeek
Subscribe to MoneyWeek today and get your first six magazine issues absolutely FREE

Sign up to Money Morning
Don't miss the latest investment and personal finances news, market analysis, plus money-saving tips with our free twice-daily newsletter
Don't miss the latest investment and personal finances news, market analysis, plus money-saving tips with our free twice-daily newsletter
My failed trade

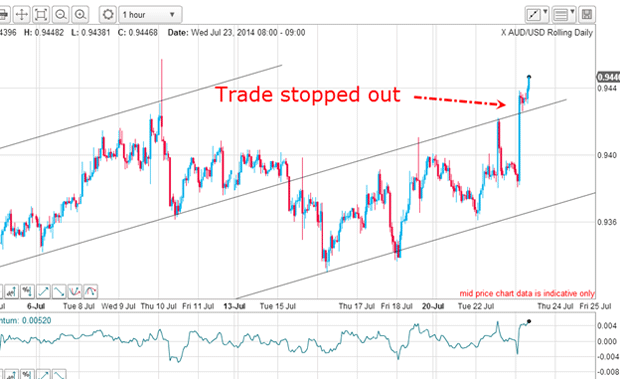
The first kiss on 18 July was a possible short trade, as was the second kiss on 22 July. But the huge rally on 23 July took out all the buy stops and those trades were losers.
With that failure, I decided to abandon those tramlines, wait for further developments, and seek another trade if presented and look for new tramlines. It was time to step back and look at the bigger picture again.
The bigger picture

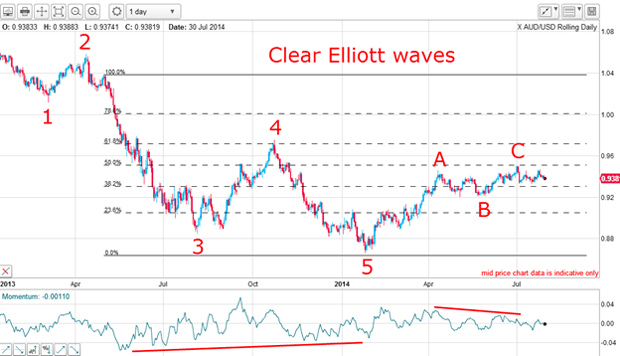
The long-term trend is down, but the short-term trend is up. The move down to the early 2014 low is a clear impulsive five-wave pattern with a long and strong w3. Note also the positive-momentum divergence at the w5 low (which itself has a clear five-wave pattern!).
This complete large wave set the scene for the textbook A-B-C corrective rally which seems to be in its final stages. There is a good negative-momentum divergence at the recent high and the C wave high made a very close hit on the Fibonacci 50% level. This is one of the most common retracement levels.
This is an ideal setup for short trades.
The ideal trade entry point

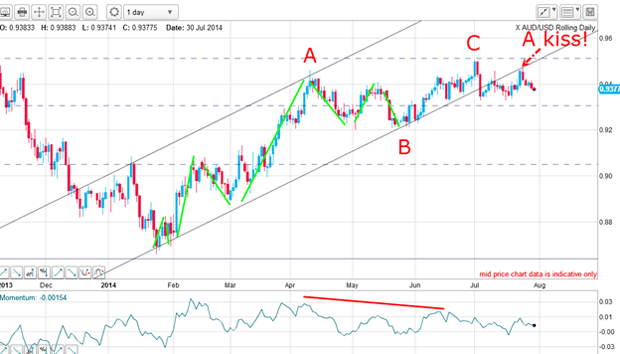
This is the relief rally off the w5 low made in January. There are several important features to this A-B-C pattern.
First, my A wave sports a clear five-wave impulsive form (marked in green). My w3 is not long and strong here, but it is certainly strong with a very high momentum reading along its length. That is enough to qualify it as a third wave. My fifth wave is an extended one and carries to the A wave high.
Second, my B wave is a classic three-wave form (marked in green). I like to see fourth waves showing a three-wave form.
Finally, the C wave terminates at the Fibonacci 50% level and if you look closely, you will find it has a five sub-wave pattern which indicates its termination.
I can also draw in a credible tramline pair and the break of the lower tramline confirms the trend has very likely changed.
All of this is pure textbook and heralds a resumption of the larger downtrend. Then, on 3 July, the market duly broke below the lower tramline and rallied to make those rogue' kisses I show on the top chart.
But on 23 July, the market made one more accurate kiss and is currently in a scalded-cat bounce down. That kiss was the ideal trade entry point.
But if you missed that entry, were there other low-risk kiss entries available?
The best way to deal with a losing trade

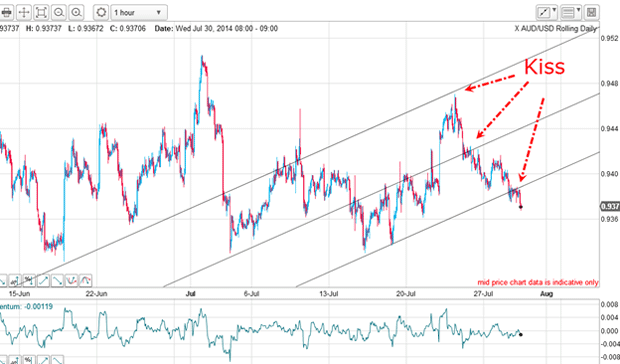
The upper tramline is the lower tramline on the daily chart and I have drawn two more tramlines to follow the market down off the 24 July high. Since then, the market has broken each tramline and made kisses and scalded-cat bounces.
As I write, the market has just kissed the lowest tramline and appears to be in a scalded-cat bounce down.
Either kiss was a new opportunity to place a low-risk trade. In the space of a few days, I have found three clear opportunities to enter low-risk trades.
The currency markets, of which there are dozens of crosses, is an ideal hunting ground for these types of opportunities.
So, from my initial losing trade, I have found several potential winners. This is an object lesson in why you should put your losing trades behind you and keep looking at that market for opportunities. You usually do not have to wait too long!
Get the latest financial news, insights and expert analysis from our award-winning MoneyWeek team, to help you understand what really matters when it comes to your finances.
John is is a British-born lapsed PhD physicist, who previously worked for Nasa on the Mars exploration team. He is a former commodity trading advisor with the US Commodities Futures Trading Commission, and worked in a boutique futures house in California in the 1980s.
He was a partner in one of the first futures newsletter advisory services, based in Washington DC, specialising in pork bellies and currencies. John is primarily a chart-reading trader, having cut his trading teeth in the days before PCs.
As well as his work in the financial world, he has launched, run and sold several 'real' businesses producing 'real' products.
-
 Average UK house price reaches £300,000 for first time, Halifax says
While the average house price has topped £300k, regional disparities still remain, Halifax finds.
-
 Barings Emerging Europe trust bounces back from Russia woes
Barings Emerging Europe trust has added the Middle East and Africa to its mandate, delivering a strong recovery, says Max King