Has the stockmarket finally reached its “ah-ha” moment?
People have suddenly realised that the downtrend is here to stay and bearish forces have taken over, says John C Burford.
Get the latest financial news, insights and expert analysis from our award-winning MoneyWeek team, to help you understand what really matters when it comes to your finances.
You are now subscribed
Your newsletter sign-up was successful
Want to add more newsletters?

Twice daily
MoneyWeek
Get the latest financial news, insights and expert analysis from our award-winning MoneyWeek team, to help you understand what really matters when it comes to your finances.

Four times a week
Look After My Bills
Sign up to our free money-saving newsletter, filled with the latest news and expert advice to help you find the best tips and deals for managing your bills. Start saving today!
Is this is a rare time when extreme bearish sentiment accompanies a major decline rather than indicating a major reversal immediately ahead?
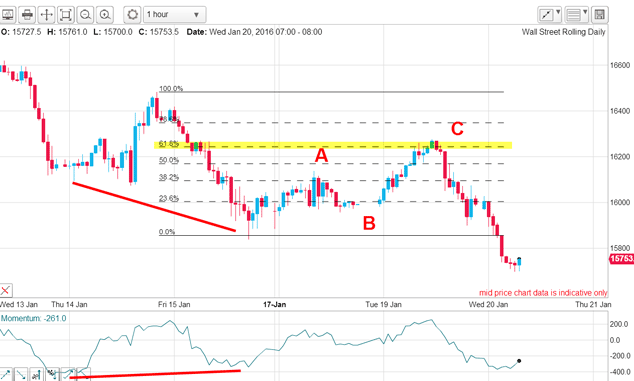
Last Friday, I was looking for a counter-trend rally in stocks based on my headline indicator (HI) which was flashing a possible bounce up ahead. As I wrote, the bounce that materialised was small. So to catch a possible bigger bounce, I needed to see a move above my short-term tramline and that never came.
There was a brief rally yesterday following the China growth data release. Here is the hourly chart
MoneyWeek
Subscribe to MoneyWeek today and get your first six magazine issues absolutely FREE

Sign up to Money Morning
Don't miss the latest investment and personal finances news, market analysis, plus money-saving tips with our free twice-daily newsletter
Don't miss the latest investment and personal finances news, market analysis, plus money-saving tips with our free twice-daily newsletter

A bounce was signalled by the momentum divergence into the Friday low, but it was weak and in the A-B-C form with wave C hitting the Fibonacci 62% resistance. That resistance was too much and the market has continued down this morning into new lows.
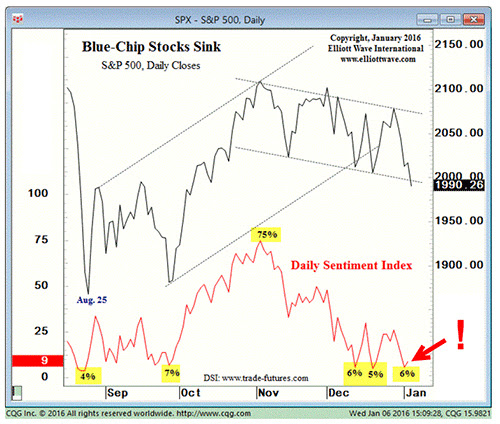
I have been diligently following market sentiment by means other than HI as well and one of my most reliable indicators is the Daily Sentiment Index (DSI) and this was the chart I showed last week

The first dip to the 6% bulls level in December was immediately followed by a decent and tradable bounce. Similarly, the second dip to the 5% level was followed by an even larger bounce. But since late December, the DSI has reached 6% again and no bounce. Is this third time unlucky?
In fact, the DSI has remained around the 6% level while the S&P has declined by a stunning 150 points this month.
So how come the DSI worked as a counter-trend signal twice in December, but not this time in January? Has the underlying dynamic changed? I believe it has and that highlights one of the guidelines of using sentiment indicators.
When a market is in a major third wave, DSI (and other) indicators) can stay on the floor for a very long time before a major low is reached. In fact, there is a time that Robert Prechter calls "the ah-ha" moment. It is when the lightbulb switches on and many pundits suddenly realise that the downtrend is here to stay and bearish forces have taken over.
This morning on the eve of Davos, it is reported that one of the "establishment" figures (who normally are "don't rock the boat" advocates) has said the world faces waves of epic debt defaults and is worse than 2007.
It seems the world of economics is divided into two camps the Keynesians (almost everybody) and the Austrian School (considered cranks by most). The Keynesians have total control of governments and they advocate state spending, central bank QE/ZIRP and fiat money and debt as the means of controlling the economies (and inflation).
Austrians advocate hard money, free markets and private banks (no central banks) and small governments. I have a feeling it is they that will eventually emerge victorious, but only after the debt time bombs have blown up economies.
As a matter of record, I have been warning of this disaster for a long time, as have some others. But to have the chairman of the OECD review committee (and former chief economist of the Bank for International Settlements) make such a stark warning is as noteworthy as the RBS "Sell Everything" advice of last week.
The supreme example of the utter impossibility of debt and interest repayments is of course Greece. The EU has been rolling over its huge debt load for years, but how much road is there left to kick the poor old can down?
So have we reached that "ah-ha" moment? If so, another curious thing is that these lie normally about half-way through the third wave. What are the implications?
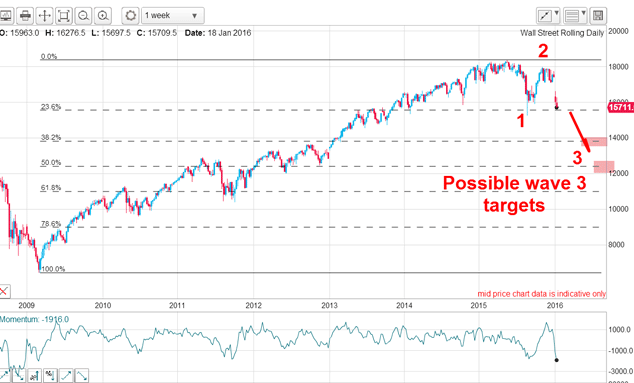
Here is the weekly Dow since the 2009 low:

If we are indeed half-way along wave 3, that would place the Fibonacci 38% level as an "ideal" target at the 14,000 level (1,700 points under the current market).
Of course, since third waves are long and strong, cascades of selling could force the market to the Fibonacci 50% level at around 12,500 before making a major low, especially if debt defaults escalate and involve some household names.
This is the deflationary depression scenario I have been forecasting. Debt will have to be written off, and asset prices from art to vintage cars to London mansions to FANG shares to bloated salaries/bonuses will be under great pressure. Wealth is being destroyed and there is a lot more to come.
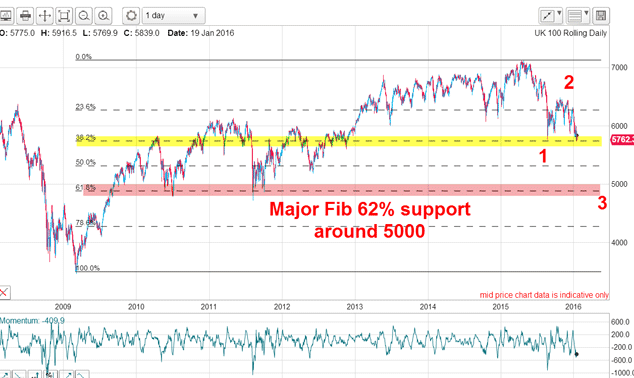
In terms of the FTSE 100, here are my projections:

The market is testing once again the Fibonacci 38% support level in wave 3 and once it gives way, my major target is the 5,000 area. That was the area of previous support in 2010 and 2011 and I expect it is still working.
Look out below!
Get the latest financial news, insights and expert analysis from our award-winning MoneyWeek team, to help you understand what really matters when it comes to your finances.
John is is a British-born lapsed PhD physicist, who previously worked for Nasa on the Mars exploration team. He is a former commodity trading advisor with the US Commodities Futures Trading Commission, and worked in a boutique futures house in California in the 1980s.
He was a partner in one of the first futures newsletter advisory services, based in Washington DC, specialising in pork bellies and currencies. John is primarily a chart-reading trader, having cut his trading teeth in the days before PCs.
As well as his work in the financial world, he has launched, run and sold several 'real' businesses producing 'real' products.
-
 Should you buy an active ETF?
ETFs are often mischaracterised as passive products, but they can be a convenient way to add active management to your portfolio
-
 Power up your pension before 5 April – easy ways to save before the tax year end
With the end of the tax year looming, pension savers currently have a window to review and maximise what’s going into their retirement funds – we look at how