How volatility will affect the euro from now on
A new era of increased volatility beckons for the euro, says John C Burford. And as he explains here, that will provide rich hunting grounds for chart-following swing traders.
Get the latest financial news, insights and expert analysis from our award-winning MoneyWeek team, to help you understand what really matters when it comes to your finances.
You are now subscribed
Your newsletter sign-up was successful
Want to add more newsletters?

Twice daily
MoneyWeek
Get the latest financial news, insights and expert analysis from our award-winning MoneyWeek team, to help you understand what really matters when it comes to your finances.

Four times a week
Look After My Bills
Sign up to our free money-saving newsletter, filled with the latest news and expert advice to help you find the best tips and deals for managing your bills. Start saving today!
In today's post, I thought I would very briefly explain my views on where we are in the world economy and the financial markets, because I believe this year is a pivotal time in the world order. And my views will dictate my trading as they do for all other traders, of course.
I believe we are in a historic transition from the old paradigms into a new world.
Just yesterday, I read that cyber-attacks are a new major menace with one FTSE company last year losing £800m in revenue because of state-sponsored attacks (China?). Incidentally, this is just one of the many hazards to investing in individual shares and will become a rationale for private investors to retreat from the stock market in the next few years.
MoneyWeek
Subscribe to MoneyWeek today and get your first six magazine issues absolutely FREE

Sign up to Money Morning
Don't miss the latest investment and personal finances news, market analysis, plus money-saving tips with our free twice-daily newsletter
Don't miss the latest investment and personal finances news, market analysis, plus money-saving tips with our free twice-daily newsletter
In the financial arena in recent years, we have had a series of manias that have blown up and devastated investors (the dotcom bubble, the credit crunch, and now gold). Much of the original buying was leveraged (done using credit). And when this experience is repeated in stocks, as I believe it will be, the disillusion with the market will become terminal.
The new age of the volatile bear market
Today, credit (and its converse, debt) is awash in all societies and in all areas of finance. The fiat banking system, where a £1 deposit can be loaned out multiple times by the banks, has stretched this model to its limit. The subprime collapse in the USA in 2007/2009 was a warning that credit and debt volumes had reached a limit.
And since WWII, equity ownership has mushroomed it has been the age of share ownership as a way to create wealth. I believe that this year will see a transition to a general divesting of share ownership brought about by major declines. Interestingly, the great bull market since 2009 has seen declining trading volumes of share dealings as the market has rallied this despite the growth of high-frequency trading.
I see a massive contraction of credit around the world as interest rates rise. And because of the enormous leverage in many markets, this contraction and its accompanying bear markets will be very swift at times.
The world's central banks will pull out all the stops to prevent this, of course.
The great war now being waged between the entrenched decades-old forces of inflation of credit and the new forces of deflation (where creditors are unable to service their debts) will produce wild swings in markets. Volatility will reign.
This is the background I believe I will be trading in from now on. And that is why a simple buy-and-hold, or even hold-and-stay-away strategy will be most problematic. I intend to continue trading the swings, both up and down.
The euro finds major support

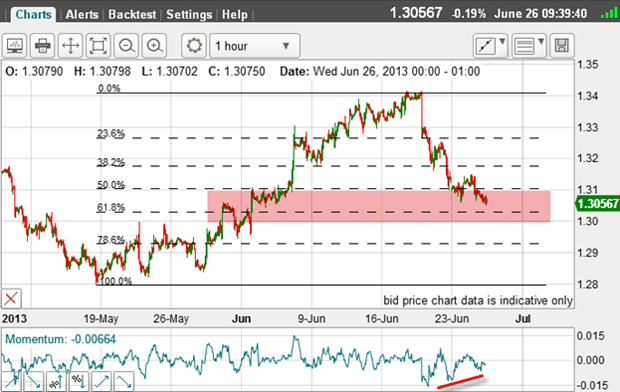
The momentum was making a potential positive divergence (red bar) and the market was entering chart support and the Fibonacci 62% support level wasn't far away.
I wrote: "Putting all of this together, I have a great case for taking a short-term profit on my short trade, as the odds favour a rally of some sort from here."
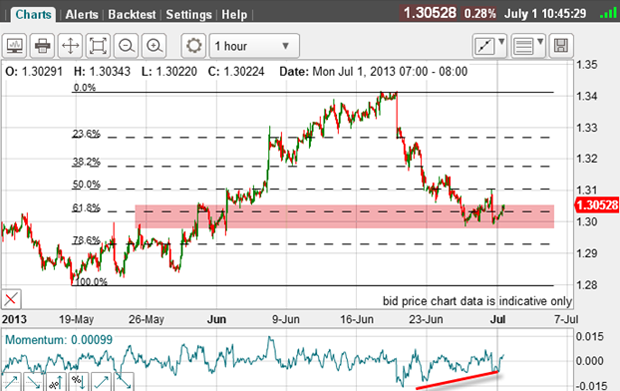
And since then, the market has declined a touch more to the 62% level and the 1.30 level and this morning is showing a few signs of strength:

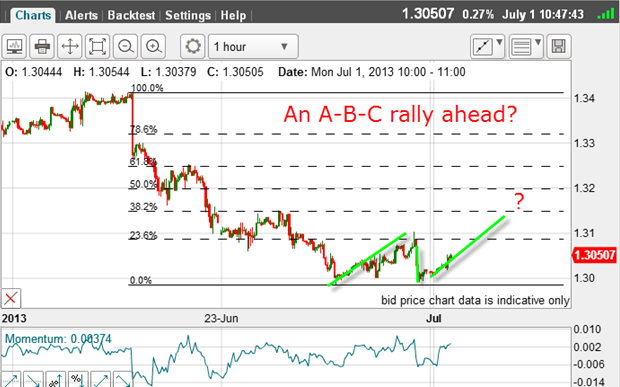
The market seems to be respecting the 1.30 level as major support. So let us suppose this is a pivot low. Let's apply the Fibonacci levels now.

This is a very possible scenario an A-B-C rally to one of the Fibonacci levels.
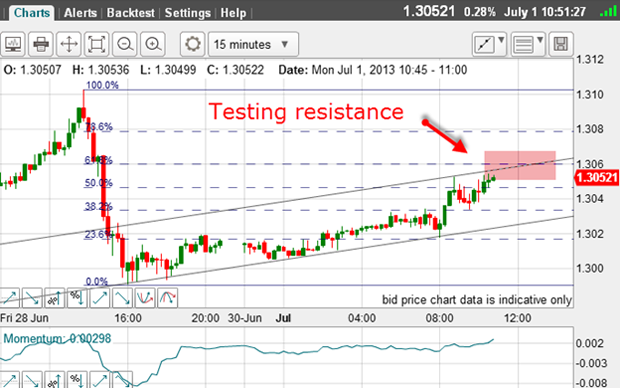
Looking at the near-term, I can draw a very good tramline pair on the 15-minute chart:

As I write, the market has rallied to the Fibonacci 50% retrace and is testing the upper tramline.
This is always the moment of truth in these situations. A break of the lower tramline would be negative for the bullish case.
And a break of the 1.30 lows would surely herald a move back down to the 1.28 area.
Get the latest financial news, insights and expert analysis from our award-winning MoneyWeek team, to help you understand what really matters when it comes to your finances.
John is is a British-born lapsed PhD physicist, who previously worked for Nasa on the Mars exploration team. He is a former commodity trading advisor with the US Commodities Futures Trading Commission, and worked in a boutique futures house in California in the 1980s.
He was a partner in one of the first futures newsletter advisory services, based in Washington DC, specialising in pork bellies and currencies. John is primarily a chart-reading trader, having cut his trading teeth in the days before PCs.
As well as his work in the financial world, he has launched, run and sold several 'real' businesses producing 'real' products.
-
 MoneyWeek Talks: The funds to choose in 2026
Podcast Fidelity's Tom Stevenson reveals his top three funds for 2026 for your ISA or self-invested personal pension
-
 Three companies with deep economic moats to buy now
Opinion An economic moat can underpin a company's future returns. Here, Imran Sattar, portfolio manager at Edinburgh Investment Trust, selects three stocks to buy now