Has Royal Mail turned the corner?
Elliott wave theory is great for giving you an idea of where the market is heading, says John C Burford. That's invaluable for swing traders.
Get the latest financial news, insights and expert analysis from our award-winning MoneyWeek team, to help you understand what really matters when it comes to your finances.
You are now subscribed
Your newsletter sign-up was successful
Want to add more newsletters?

Twice daily
MoneyWeek
Get the latest financial news, insights and expert analysis from our award-winning MoneyWeek team, to help you understand what really matters when it comes to your finances.

Four times a week
Look After My Bills
Sign up to our free money-saving newsletter, filled with the latest news and expert advice to help you find the best tips and deals for managing your bills. Start saving today!
One of the wonderful benefits of using Elliott wave theory(EWT) in your chart analysis is that it gives you a likely roadmap for the future. I appreciate that EWT strikes fear into the heart of many, but it needn't do. Like anything worthwhile in life, proficiency requires practice.
Your EW count is always based on currently available evidence, which is always incomplete. I apply my Elliott wave (EW) labels which seem to be the most fitting at the time. But there are usually other competing interpretations possible. Only with the passage of time can a winning EW count emerge but by then, it is too late to profit. You have to get in early before the pattern is obvious to all and sundry.
There is one aspect of EWT that is especially crucial: your count. If your count is wrong, the market will quickly tell you, giving you time to exit that trade with a minor loss.
MoneyWeek
Subscribe to MoneyWeek today and get your first six magazine issues absolutely FREE

Sign up to Money Morning
Don't miss the latest investment and personal finances news, market analysis, plus money-saving tips with our free twice-daily newsletter
Don't miss the latest investment and personal finances news, market analysis, plus money-saving tips with our free twice-daily newsletter
Today, I want to show how the roadmap I outlined in Royal Mail shares in my postof 6 October seems to be going to plan so far. I will have examples of where my preferred EW count was not the correct one in later posts.
My tramline analysis of the Royal Mail chart
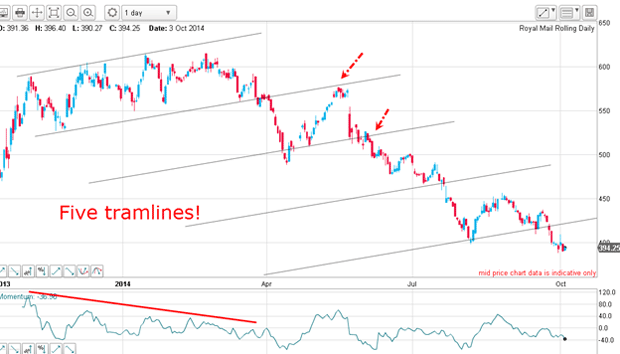
Back on 6 October, this was my tramline analysis of the Royal Mail chart since launch last year:

I have five superb tramlines working and the market had just broken below the fifth tramline. It really looked as if the market was in freefall and headed much lower. But appearances can often be deceiving, especially in price charts.
The tramline break in the 550 area and the subsequent kiss were the natural low-risk trade entries.
But with the market sold down to the 400 area a major loss of about 30% will the market continue falling, or will it find support?
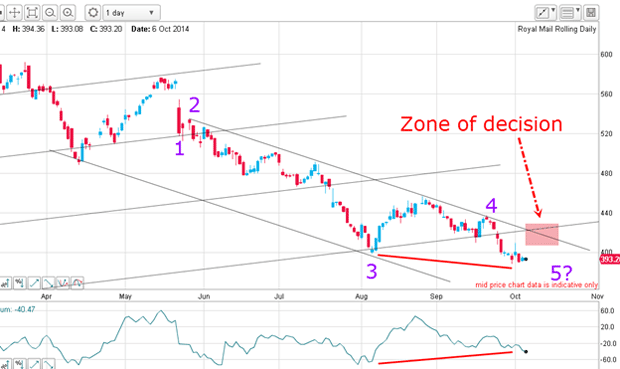
This was the daily chart then:

I had a decent tramline pair where the market had traced out a five-wave pattern within the trading channel. The fifth wave had moved only slightly below the w3 low, but on a possible positive-momentum divergence.
I marked the pink area as a zone of decision, because if the fifth wave had ended, a rally would either lead to a kiss or a break back above the lower tramlines.
This is what I wrote: "Naturally, it is too soon to call the bottom as fifth waves can extend much lower. But if the market can rally, it would enter my zone of decision and either plant a kiss with a scalded-cat bounce down, or zoom upwards breaking my upper tramline.
"We shall soon see which scenario plays out."
Was my original EW count correct?
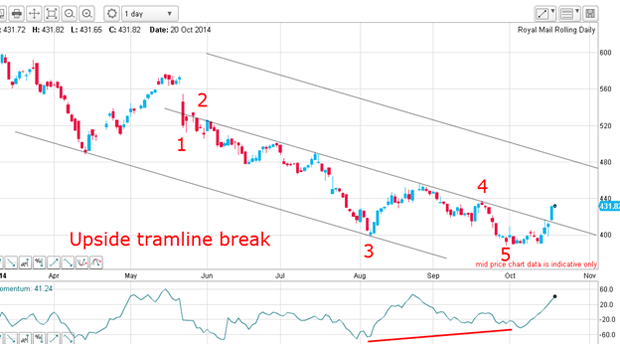
As it happened, the market did rally and broke above my tramline and past my zone of decision:

That action has confirmed that my original EW count was correct.
If the market had continued lower, my count would still be in play because the fifth wave would be extended.
The market is now challenging the previous w4 high, and a break above this level would place my third tramline as a likely upside target in the 460-470 area, depending on how long it would take to get there.
The benefits of being a swing trader
Now that we have a confirmed and completed five-wave count, the most likely pattern is an A-B-C corrective move.
For our nimble trader who took profits on longs and then reversed to short at the 550 level, that short trade would have been covered on the tramline break at the 420 level and then reversed and went long.
The move down resulted in a 130 point profit. Now, the long trade would be protected by a close sell stop, of course.
But for a buy-and-hold investor, they would have seen their maximum gain reduced by well over 30% and must be now wondering if the bull market could pick up again from here, or if the downtrend will resume.
But the nimble trader does not have these worries! He or she rode the swings up then down for superb profits on both steps much greater that the buy-and-hold investor. And they have a promising long trade working!
This is a great example of why I swing trade in preference to taking a buy-and-hold stance in equities.
Of course, buy-and-hold investors have the benefit of any dividends, but these are usually minor compared with the potential profits available in swing trading.
The recent short trade resulted in a 130 point gain in about six months. The latest dividend was only one tenth of that at 13 pence per share. I rest my case.
But disciplined swing trading takes work and effort. It is definitely not a set-and-forget technique!
Get the latest financial news, insights and expert analysis from our award-winning MoneyWeek team, to help you understand what really matters when it comes to your finances.
John is is a British-born lapsed PhD physicist, who previously worked for Nasa on the Mars exploration team. He is a former commodity trading advisor with the US Commodities Futures Trading Commission, and worked in a boutique futures house in California in the 1980s.
He was a partner in one of the first futures newsletter advisory services, based in Washington DC, specialising in pork bellies and currencies. John is primarily a chart-reading trader, having cut his trading teeth in the days before PCs.
As well as his work in the financial world, he has launched, run and sold several 'real' businesses producing 'real' products.
-
 Average UK house price reaches £300,000 for first time, Halifax says
While the average house price has topped £300k, regional disparities still remain, Halifax finds.
-
 Barings Emerging Europe trust bounces back from Russia woes
Barings Emerging Europe trust has added the Middle East and Africa to its mandate, delivering a strong recovery, says Max King