Great tramlines in T-bonds
Investors of all stripes are piling into bonds and bond funds because of their distrust of equities. So the important question to be asked is which way for yields? John C Burford looks for clues in the tramlines.
Get the latest financial news, insights and expert analysis from our award-winning MoneyWeek team, to help you understand what really matters when it comes to your finances.
You are now subscribed
Your newsletter sign-up was successful
Want to add more newsletters?

Twice daily
MoneyWeek
Get the latest financial news, insights and expert analysis from our award-winning MoneyWeek team, to help you understand what really matters when it comes to your finances.

Four times a week
Look After My Bills
Sign up to our free money-saving newsletter, filled with the latest news and expert advice to help you find the best tips and deals for managing your bills. Start saving today!
Are bonds in a bubble? That is a question has popped up again and again in recent weeks. My colleague John Stepek had an insightful article on the subject last Thursday. He pointed out that putting new money into bonds, which are trading at or near record highs, is the opposite of the golden rule buy low, sell high.
But many investors of all stripes are still piling into bonds and bond funds because of their distrust of equities. It is the return of their investment that is paramount for them, rather than a return on their investment.
Because bonds have performed so very well in the past few years (since 1981, in fact), many have been lulled into ignoring counterparty risk, and have driven US muni' bonds and junk bonds yields to very low levels. That's in spite of their historic tendency to default.
MoneyWeek
Subscribe to MoneyWeek today and get your first six magazine issues absolutely FREE

Sign up to Money Morning
Don't miss the latest investment and personal finances news, market analysis, plus money-saving tips with our free twice-daily newsletter
Don't miss the latest investment and personal finances news, market analysis, plus money-saving tips with our free twice-daily newsletter
I follow the US Treasury (T-bond) market, and have done so for many years. It is the fulcrum around which all other markets turn, especially stocks and commodities (including notably gold).
With stocks well off their recent highs, 30-year T-bond yields have been pushed down to a summer low of 2.44%. But now, yields are creeping up as difficult decisions must be made very soon regarding the US budget and tax affairs (the fiscal cliff').
So, the question any bond trader is askingiswhich way for yields? Is the bubble finally bursting?
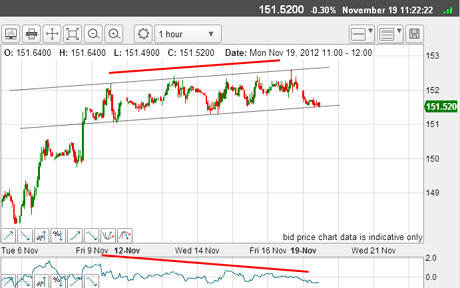
With the massive 1,000 point fall in the Dow from early October, the T-bonds did rally, as expected. But with the Dow bounce, this is what the T-bonds have done to last Monday:

(Click on the chart for a larger version)
The market traced out a lovely channel between my tramlines. Not only that, but a very large negative momentum divergence has formed.
Note how every time the market reached for the upper tramline, it was promptly repelled (as highlighted by the pig-tails' on the candles). That is a sign of pending reversal.
I have seen a great many such formations over the years, and they usually spell one thing: a top.
That was when I entered shorts at the 151.50 area and placed a protective stop just above the upper tramline.
Since then the market has worked lower, confirming the top. It may not be the top - only time will tell. But at least, I have a new mini-trend I can work with.
So, have the bonds moved down, as I hoped?

(Click on the chart for a larger version)
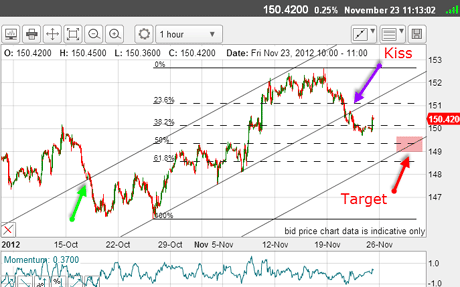
They certainly have! The decline has overshot the Fibonacci 38% level and is currently bouncing up from a short-term oversold condition.
But admire my tramlines! The centre line has three excellent touch points and when the market broke through, we had a lovely kiss and then the scalded cat bounce' down.
My upper tramline, although only having one touch point, does have a mini prior pivot point (PPP) (green arrow). This means that I have little confidence on this line. But it is the best of a bad bunch, and so my third tramline gives me my first tentative target in the pink zone around the Fibonacci 50% retrace.
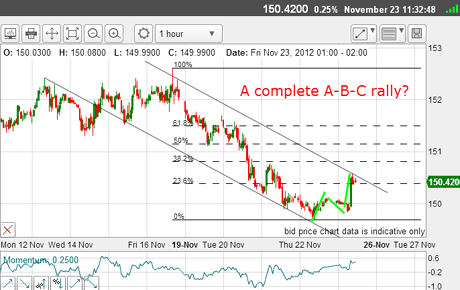
But how high will the current rally carry? Here is a close-up chart of the situation on Friday:

(Click on the chart for a larger version)
I have a terrific lower tramline with many touch points and two great PPPs. The upper line is iffy, but already, we have a clear mini-A-B-C pattern and the rally has carried to the Fibonacci 23% level the bare minimum for a Fibonacci measured retrace.
On Friday, with the market at my tramline, I might have thought of a short trade but the iffy upper tramline gave me pause.
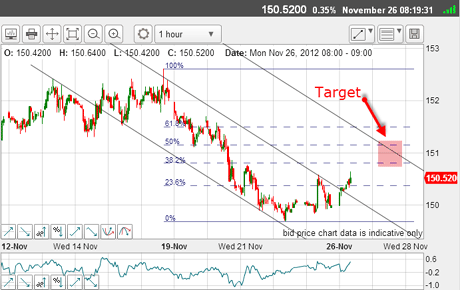
And this morning as I write, the market has punched above the tramline:

(Click on the chart for a larger version)
Because of this tramline break I am able to draw my third equidistant upper tramline, and set a possible upper target in the Fibonacci 38% -50% zone.
Remember, my lower target in the 149 area is still open.
But note the form of the rally off last Thursday's low another A-B-C. So the rally has done enough for me to say the turn back down can come at any time, especially now that momentum has reached levels from which previous turns down were made.
Take a moment to study this chart to verify this.
In fact, with the tendency for tramline breaks to be followed by a return back to test the tramline, I would expect any upside progress from here to be hard-won in the near-term.
Of course, T-Bonds do not move in a vacuum. They are stocks' inverse. So watching the Dow movements can give us much information on the bonds.
And by Friday's close, the Dow had rallied right back to the 13,000 target I had in place. As I have pointed out, I expect this resistance to be solid but not insurmountable!
If the Dow can turn back from here, the T-Bonds will catch a bid, and my possible upper target will turn out to be highly probable!
In the meantime, I have moved my protective stop on my 151.50 trade to break-even.
And because the Dow has carried to my zone of resistance, I will cover it on Wednesday.
If you're a new reader, or need a reminder about some of the methods I refer to in my trades, then do have a look at my introductory videos:
The essentials of tramline trading
An introduction to Elliott wave theory
Advanced trading with Elliott waves
Don't miss my next trading insight. To receive all my spread betting blog posts by email, as soon as I've written them, just sign up here . If you have any queries regarding MoneyWeek Trader, please contact us here.
Get the latest financial news, insights and expert analysis from our award-winning MoneyWeek team, to help you understand what really matters when it comes to your finances.
John is is a British-born lapsed PhD physicist, who previously worked for Nasa on the Mars exploration team. He is a former commodity trading advisor with the US Commodities Futures Trading Commission, and worked in a boutique futures house in California in the 1980s.
He was a partner in one of the first futures newsletter advisory services, based in Washington DC, specialising in pork bellies and currencies. John is primarily a chart-reading trader, having cut his trading teeth in the days before PCs.
As well as his work in the financial world, he has launched, run and sold several 'real' businesses producing 'real' products.
-
 MoneyWeek Talks: The funds to choose in 2026
Podcast Fidelity's Tom Stevenson reveals his top three funds for 2026 for your ISA or self-invested personal pension
-
 Three companies with deep economic moats to buy now
Opinion An economic moat can underpin a company's future returns. Here, Imran Sattar, portfolio manager at Edinburgh Investment Trust, selects three stocks to buy now