Great results in US Treasuries
The US Treasury bond market - and the 30 year bond in particular - has presented some excellent trading opportunities lately. And John C Burford’s methods have been working like a dream.
Get the latest financial news, insights and expert analysis from our award-winning MoneyWeek team, to help you understand what really matters when it comes to your finances.
You are now subscribed
Your newsletter sign-up was successful
Want to add more newsletters?

Twice daily
MoneyWeek
Get the latest financial news, insights and expert analysis from our award-winning MoneyWeek team, to help you understand what really matters when it comes to your finances.

Four times a week
Look After My Bills
Sign up to our free money-saving newsletter, filled with the latest news and expert advice to help you find the best tips and deals for managing your bills. Start saving today!
As a long-term stock bear, I am being forced, with a painful expression, to watch stock markets zoom upwards. But no matter what I do I just cannot force myself to trade from the long side. It must be one of my trader biases that I write about!
But better to keep powder dry than to risk an uncertain trade. I simply have not been able to find a decent entry point in the Dow using tramlines.
The flip side is that the US Treasury market in particular, my favourite 30-year long bond has been trading inverse to stocks (in true 'risk-on' mode) and has been falling. And it has been presenting some mighty good trading opportunities! My trading methods have really been working here, thankfully.
MoneyWeek
Subscribe to MoneyWeek today and get your first six magazine issues absolutely FREE

Sign up to Money Morning
Don't miss the latest investment and personal finances news, market analysis, plus money-saving tips with our free twice-daily newsletter
Don't miss the latest investment and personal finances news, market analysis, plus money-saving tips with our free twice-daily newsletter
The market followed my analysis
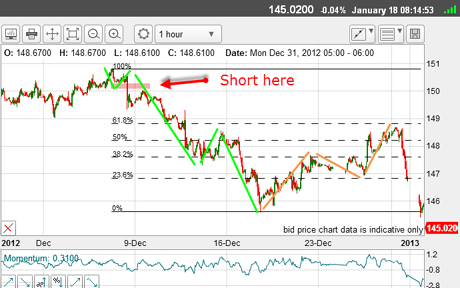
In early December, I had positioned short. From there, the market declined by over 400 points in a clear five-wave Elliott pattern. That confirmed the larger trend was down.
The third wave contained five minor waves and there was a positive momentum divergence at the low.
If I was trading in the very short-term, I would be looking to take profits in the 146-147 area.
But I decided to stay with this trade and look to add to positions on a rally, which duly appeared.
The reason was simply that I am long-term bearish the bonds and wish to build up a long-term position.
Here is the chart:

(Click on the chart for a larger version)
The market has reached very high levels over 150 and my analysis suggested that the market would turn from around this level to start a long-term downtrend.
I watched the market rally in an A-B-C (tan bars) to the Fibonacci 50%-62% area where I was looking to position short again.
And indeed, the market turned and started down.
The reason behind the large gap
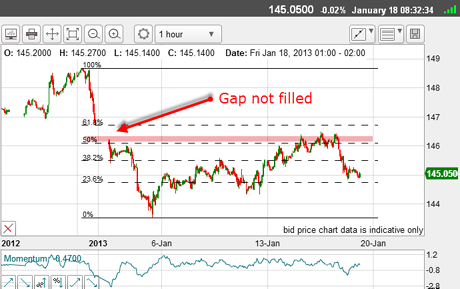
When the stock markets opened strongly on 2 January, Treasuries opened with a large gap down. Because of near-24 hour trading, we do not often see gaps in the charts trading is almost continuous. But because of the extended holiday, orders were piled up ready for the opening. The majority of sell orders created the gap down.
In the olden days (before 24-hour trading), gaps were common (in fact, individual stocks are not traded 24 hours and do display gaps).
Typically, a major gap (as this was) is filled in before the trend is resumed. That caused me to look for a rally back towards the gap. And if the rally could turn near a Fibonacci level, I would look again to add to my two short positions.

(Click on the chart for a larger version)
And sure enough, the rally was a clear A-B-C and turned just above the Fibonacci 50% level where I added another short trade.
The market made it back only to the underside of the gap, leaving the gap unfilled. This is significant, and shows the market really wants to work lower.
So far, it's textbook.
Keep an eye on all markets
As I write today, what are the prospects from here?

(Click on the chart for a larger version)
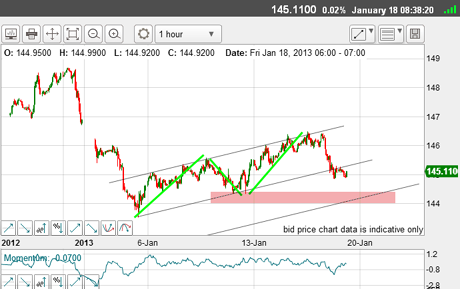
These are my excellent tramlines on the hourly, showing the clear A-B-C rally.
With the market having just broken the centre tramline, I must be looking at a move down to the lower tramline. Conveniently, this is also the area of chart support marked by my pink bar.
But there is quite a lot of congestion in the 145 area, so I must be prepared for more work in this area.
What could get the market moving lower is an immediate corresponding rally in stocks. But with the Dow pushing the giddy heights at 13,600 and flashing bright lights of "Overbought!", this may not occur right away.
I missed the boat on the Dow, but am making up for it in the T-bonds. I advise all traders to keep an eye on all markets that are connected to your favourites they may be offering you great trading opportunities that you may be missing.
If you're a new reader, or need a reminder about some of the methods I refer to in my trades, then do have a look at my introductory videos:
The essentials of tramline trading
An introduction to Elliott wave theory
Advanced trading with Elliott waves
Don't miss my next trading insight. To receive all my spread betting blog posts by email, as soon as I've written them, just sign up here . If you have any queries regarding MoneyWeek Trader, please contact us here.
Get the latest financial news, insights and expert analysis from our award-winning MoneyWeek team, to help you understand what really matters when it comes to your finances.
John is is a British-born lapsed PhD physicist, who previously worked for Nasa on the Mars exploration team. He is a former commodity trading advisor with the US Commodities Futures Trading Commission, and worked in a boutique futures house in California in the 1980s.
He was a partner in one of the first futures newsletter advisory services, based in Washington DC, specialising in pork bellies and currencies. John is primarily a chart-reading trader, having cut his trading teeth in the days before PCs.
As well as his work in the financial world, he has launched, run and sold several 'real' businesses producing 'real' products.
-
 Adventures in Saudi Arabia
Travel The kingdom of Saudi Arabia in the Middle East is rich in undiscovered natural beauty. Get there before everybody else does, says Merryn Somerset Webb
-
 ISA fund and trust picks for every type of investor – which could work for you?
Whether you’re an ISA investor seeking reliable returns, looking to add a bit more risk to your portfolio or are new to investing, MoneyWeek asked the experts for funds and investment trusts you could consider in 2026