We could be in for a serious rally in gold
Gold is winding in a coil, ready to spring higher, says John C Burford. Here, he uses Fibonacci theory to set his next price target.
Get the latest financial news, insights and expert analysis from our award-winning MoneyWeek team, to help you understand what really matters when it comes to your finances.
You are now subscribed
Your newsletter sign-up was successful
Want to add more newsletters?

Twice daily
MoneyWeek
Get the latest financial news, insights and expert analysis from our award-winning MoneyWeek team, to help you understand what really matters when it comes to your finances.

Four times a week
Look After My Bills
Sign up to our free money-saving newsletter, filled with the latest news and expert advice to help you find the best tips and deals for managing your bills. Start saving today!
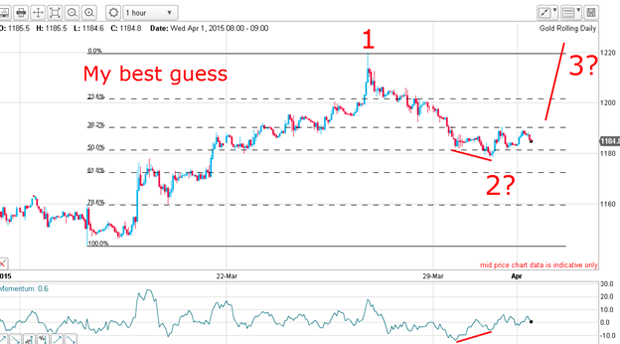
The gold market is following my road map beautifully. In my last post(1 April), I said the market was on the verge of a move up off the recent low.
I suggested that low was the wave 2 of a likely five-wave affair which would make up my complete large C wave.
This forecast was consistent with the Elliott wave model, which states that after a motive five-wave pattern has completed (which it did last November), the most likely move will be a three-wave corrective pattern usually in the form of an A-B-C rally leg.
MoneyWeek
Subscribe to MoneyWeek today and get your first six magazine issues absolutely FREE

Sign up to Money Morning
Don't miss the latest investment and personal finances news, market analysis, plus money-saving tips with our free twice-daily newsletter
Don't miss the latest investment and personal finances news, market analysis, plus money-saving tips with our free twice-daily newsletter
This was how the hourly chart looked then.
And this is my big picture road map on the daily from last time:
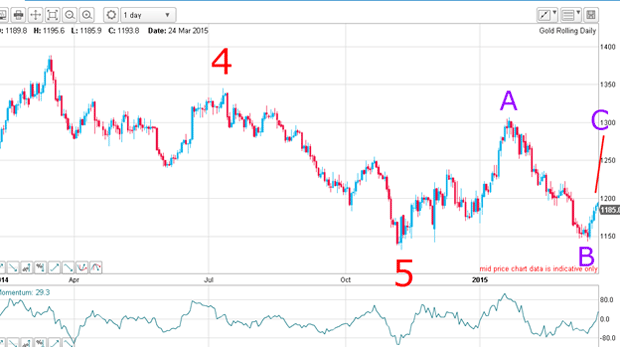
Clearly, we have waves A and B in place and the market is now in the early stages of the C wave. Ideally, this C wave will be in the form of a five-wave motive pattern with wave 3 being long and strong.
That means if we can identify wave 3 early in its formation, we could extract huge profits by riding it as far as possible. That is my plan.
Remember, third waves usually move rapidly in one direction and your profits can rack up spectacularly provided you have entered the market at low risk. Of course, this takes some skill.
Remember the golden rule: preserve your capital and reduce risk
I have often maintained that if someone offers me the choice of a great trading method with a mediocre money management system, or a mediocre method with a tight risk control system I would take the latter any day.
There is only one golden rule in trading: preserve your capital and keep reducing your risk.
That is why I spend more time in estimating and managing risk than I do in studying indicators or reading articles.
There is no system on earth that provides constant winners. The key is to reduce risk and loss on the inevitable losers, and ride the winners as far as possible. It sounds easy, but it can be so hard to put into practice.
The market passed the support test now it's in rally mode
The market rallied smartly off the 1 April lows right to the Fibonacci 50% retrace of the B wave where it hit that resistance. For short-term traders, this was an ideal time to take profits.
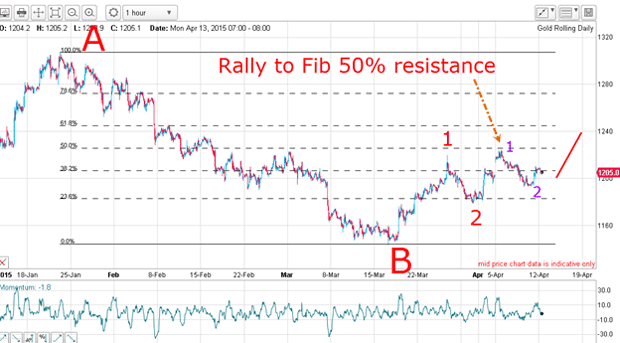
The market, as expected, was knocked back but found support at another Fibonacci level. Here is a close-up:
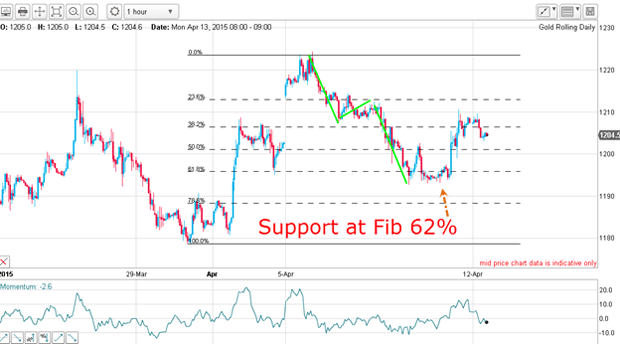
The dip has an A-B-C feel (green lines) which is corrective to the main trend. After successfully testing the support, the market is now in rally mode.
Now if you were bullishly inclined and believe you are at the start of the large C wave up, then a long trade near the Fibonacci support was in order. And your risk was small because your protective stop could have been placed just under the lows at around $1,192 for a $4 risk.
Breaking that low would likely indicate the market wanted to move lower and perhaps challenge the previous low at the $1,180 level. If you were holding a long position from say the $1,196 level, a move to $1,180 would represent a potential loss of $16, which would put it out of reach for many accounts if trading with my 3% rule.
But a stop at $1,192 would represent a loss of only $4 from entry, which is incredibly small for this market. And if the market rallies in a third wave from here, the reward/risk ratio would be enormous. Needless to say, these are the kinds of trades I am always looking for and so should you!
The gold rally is giving off another strong, bullish signal
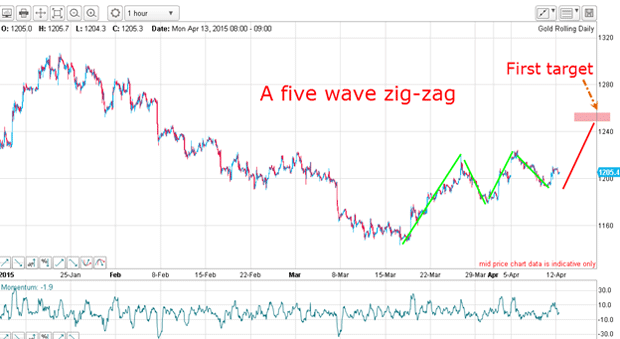
This five-wave zig-zag pattern is not to be confused with an Elliott five-wave motive pattern, which is an ending pattern. Here, my waves overlap in a zig-zag. It is as if the market is winding in a coil, ready to spring higher.
This pattern usually occurs about half way along the immediate thrust. If so, my near-term target is just above $1,240.
The pattern would only be negated by a move below $1,180. But a move above the Fibonacci 50% resistance at $1,224 would confirm the trend.
Get the latest financial news, insights and expert analysis from our award-winning MoneyWeek team, to help you understand what really matters when it comes to your finances.
John is is a British-born lapsed PhD physicist, who previously worked for Nasa on the Mars exploration team. He is a former commodity trading advisor with the US Commodities Futures Trading Commission, and worked in a boutique futures house in California in the 1980s.
He was a partner in one of the first futures newsletter advisory services, based in Washington DC, specialising in pork bellies and currencies. John is primarily a chart-reading trader, having cut his trading teeth in the days before PCs.
As well as his work in the financial world, he has launched, run and sold several 'real' businesses producing 'real' products.
-
 Inheritance tax investigations net HMRC an extra £246m from bereaved families
HMRC embarked on almost 4,000 probes into unpaid inheritance tax in the year to last April, new figures show, in an increasingly tough crackdown on families it thinks have tried to evade their full bill
-
 Average UK house price reaches £300,000 for first time, Halifax says
While the average house price has topped £300k, regional disparities still remain, Halifax finds.