Gold is starting its big rally
Gold is on the verge of breaking through a level of resistance. John C Burford explains why that's a very bullish sign.
Get the latest financial news, insights and expert analysis from our award-winning MoneyWeek team, to help you understand what really matters when it comes to your finances.
You are now subscribed
Your newsletter sign-up was successful
Want to add more newsletters?

Twice daily
MoneyWeek
Get the latest financial news, insights and expert analysis from our award-winning MoneyWeek team, to help you understand what really matters when it comes to your finances.

Four times a week
Look After My Bills
Sign up to our free money-saving newsletter, filled with the latest news and expert advice to help you find the best tips and deals for managing your bills. Start saving today!
As I forecast in Wednesday's post, Yellen of the Fed lit the blue touchpaper and the whole box of fireworks went off in an explosion of volatility. Many others foresaw the increase in volatility, of course. But did anyone see the precise reaction of the markets?
Crude was up, stocks were up, gold was up, treasury bonds were up; everything that moved was up (except the dollar). All of that volcanic eruption was the result of one word that Yellen sort of did not utter: patient'.
Ridiculous, isn't it? But that is the mainstream view of how markets work. They rest on the assumption that it is external events/news that trigger price moves.
MoneyWeek
Subscribe to MoneyWeek today and get your first six magazine issues absolutely FREE

Sign up to Money Morning
Don't miss the latest investment and personal finances news, market analysis, plus money-saving tips with our free twice-daily newsletter
Don't miss the latest investment and personal finances news, market analysis, plus money-saving tips with our free twice-daily newsletter
If that is so, why did Treasury bond prices rally hard if everyone expects the Fed to raise interest rates soon? And would that not be bearish for precious metals also? They should have collapsed, surely?
I have a different view: markets are moved by swings in sentiment and the internal working of the market (as displayed by the Elliott wave model).
So, with these huge swings in many markets since Wednesday, I have an embarrassment of riches to choose from.
I shall cover gold today because that market shows a wonderful Elliott wave pattern, which I have been following (see Monday's Trader post). In addition, the market had become extremely bearish going into Wednesday; it seemed unlikely it would go further down.
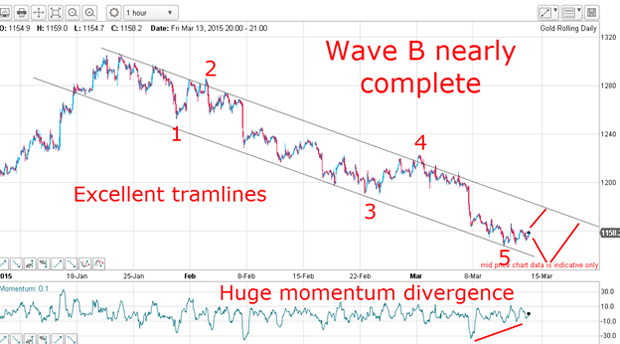
All my data suggested a rally, but timing it wasn't simple

I had another clue that gold was about to rally hard: extremely bullish commitment of traders (COT) data.
However, I was unsure whether there would be one more dip or not before the rally got under way hence the two possible paths on the above chart.
Ideally, I would like to have seen a clear five waves down within the wave 5. That would have given me a fifth of a fifth, which could pinpoint a precise long entry.
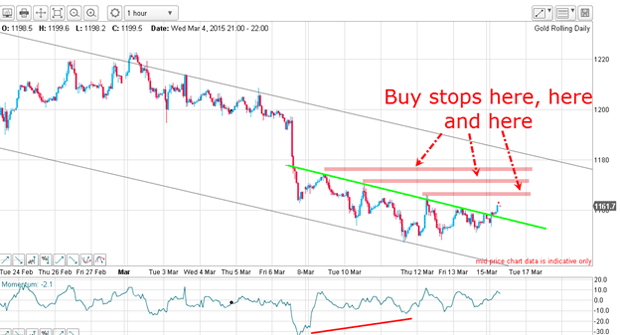
Remember, from Monday I had the critical levels above the market that I believed would come into play once my projected short squeeze got under way:

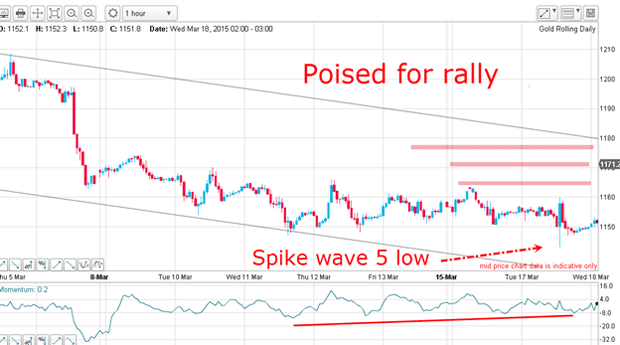
So, which path? That question was answered on Tuesday. The sell stops below the recent lows were taken out on the spike, but the market quickly recovered to trade higher.
That reversal proved that there were very few of these sell stops. If a market cannot go down, it will go up.

On Wednesday, the shorts were given a fright as the market rallied hard and sailed on through the pink resistance levels. Any one of these was an opportunity to enter a long trade.
In gold, one of the best means of entering a trade is on a stop order, where you select a level above the market you wish to enter and then enter a resting order to go long at that level. When and if the market rallies to that level, you will be filled.
Of course, you need to check on the fill regularly, because you will need to enter a protective stop when you have taken a position. Remember, gold often moves in sharp bursts; if you're monitoring the market by eye, it can jump up past your price before you know it, and you'll have missed the best entry. I recommend this practice.
Where do we stand now?

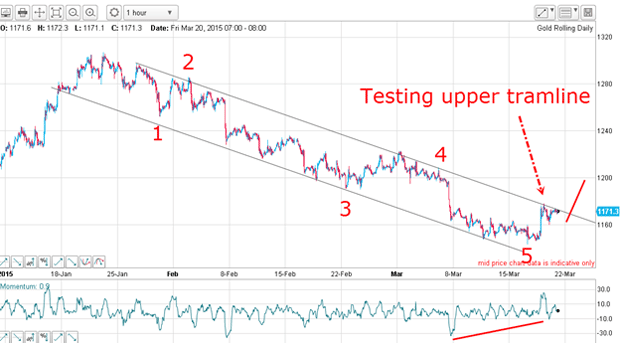
On Wednesday, the market shot up to touch the upper tramline in the $1,180 area, met that resistance, and is currently challenging it. Remember, this upper tramline represents stiff resistance (it has turned back the rallies from late Janaury).
Yesterday the market fell back off this resistance; this morning it is deciding whether to move ahead or to digest the gains some more.
If my Elliott wave analysis is correct, odds favour an eventual break and that would be a very bullish sign. My first target is at the third tramline. Students of my tramline method will know how to construct that!
Get the latest financial news, insights and expert analysis from our award-winning MoneyWeek team, to help you understand what really matters when it comes to your finances.
John is is a British-born lapsed PhD physicist, who previously worked for Nasa on the Mars exploration team. He is a former commodity trading advisor with the US Commodities Futures Trading Commission, and worked in a boutique futures house in California in the 1980s.
He was a partner in one of the first futures newsletter advisory services, based in Washington DC, specialising in pork bellies and currencies. John is primarily a chart-reading trader, having cut his trading teeth in the days before PCs.
As well as his work in the financial world, he has launched, run and sold several 'real' businesses producing 'real' products.
-
 Should you buy an active ETF?
ETFs are often mischaracterised as passive products, but they can be a convenient way to add active management to your portfolio
-
 Power up your pension before 5 April – easy ways to save before the tax year end
With the end of the tax year looming, pension savers currently have a window to review and maximise what’s going into their retirement funds – we look at how