The gold price is poised for a big rally
The gold price will zoom higher when the rally catches lurking short traders by surprise, says John C Burford.
Get the latest financial news, insights and expert analysis from our award-winning MoneyWeek team, to help you understand what really matters when it comes to your finances.
You are now subscribed
Your newsletter sign-up was successful
Want to add more newsletters?

Twice daily
MoneyWeek
Get the latest financial news, insights and expert analysis from our award-winning MoneyWeek team, to help you understand what really matters when it comes to your finances.

Four times a week
Look After My Bills
Sign up to our free money-saving newsletter, filled with the latest news and expert advice to help you find the best tips and deals for managing your bills. Start saving today!
It's a fact of life that not all trades go according to plan.
Having a method to tell you when to exit a strategy early in the game is absolutely essential. The earlier you can abandon a false setup, the smaller the loss you will take and that is always and everywhere a good thing.
Remember, a trader's first objective is not to lose money; if you do make losses, makes sure they're as small as possible. That is why I devised the very simple 3% rule and break-even rule.
MoneyWeek
Subscribe to MoneyWeek today and get your first six magazine issues absolutely FREE

Sign up to Money Morning
Don't miss the latest investment and personal finances news, market analysis, plus money-saving tips with our free twice-daily newsletter
Don't miss the latest investment and personal finances news, market analysis, plus money-saving tips with our free twice-daily newsletter
Many traders believe their only task is to guess which way the market will run. Not so. That helps, of course, but preservation of capital should be your top priority.
Let me illustrate this principle with gold. My last poston gold was on 13February. I've left it that long for two main reasons: first, I've had plenty to say on currencies and stockmarkets, both of which had been following my roadmaps in fine style. Second, gold was going nowhere and was not obeying my original script.
This was the daily chart at 13 February showing my best-guess Elliott wave scenario: the market was rallying off the wave 5 low made in November in the $1,130 region. The form of the rally suggested to me either a large A-B-C (with the large A wave consisting of a smaller A-B-C in purple as marked), or a budding five up.
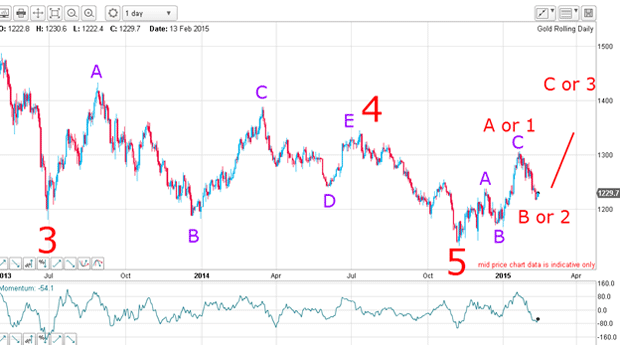
Sentiment towards gold was running negative, I believed odds favoured the five up outcome and a rally back to the $1,300 area.
This was the hourly chart a few days previously:
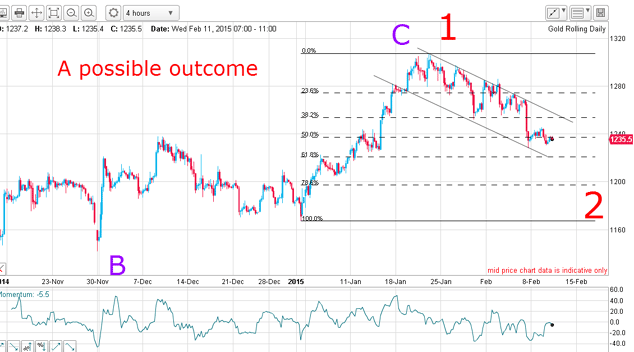
This is what I wrote at the time:"So the arrival at the $1,220 level is the moment of truth. Will gold continue its decline? If the $1,220 level holds, it strengthens my case that gold is about to rise in value".
A long trade at the $1,220 level was certainly a legitimate one and could be protected with a close stop. Unfortunately, the trade did not go as I'd hoped.
My textbook trade went wrong, but my stops kept me ahead
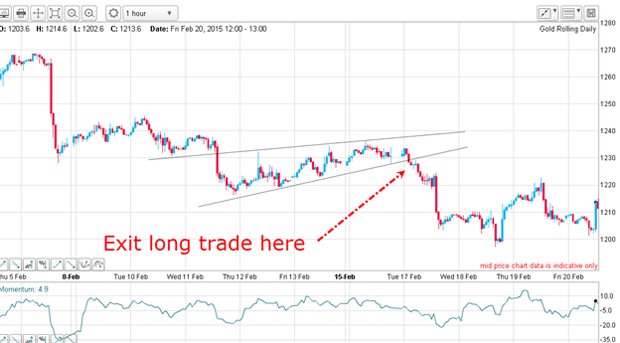
The rally was advanced enough by the following Monday to be able to draw in my wedge lines, so with the protective stop moved to just under the lower wedge line on Monday, the trade was stopped out (actually at a small profit).
The trend had obviously not turned, so I stopped looking for a long position until I saw better evidence.
Let's fast forward to today. The question is: do I still believe a big rally is approaching?
Below is the daily chart with amended Elliott waves: it shows my best guess of the Elliott waves to date. Now, because of the extended decline off the January high at the $1,300 level, I have a better handle on that B wave better than I had back in February.
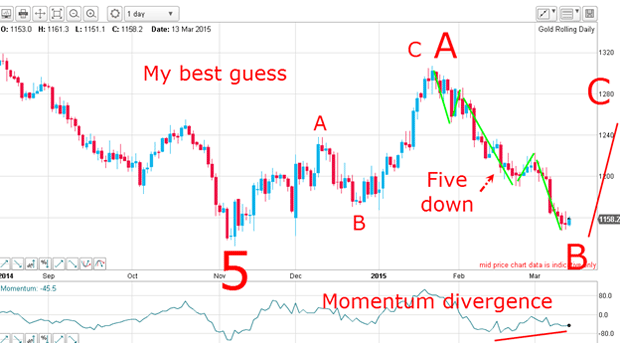
Because it has morphed into a five down (green lines) with a positive-momentum divergence, I can now make the case that gold is about ready to begin its large rally phase in the large C wave.
A look at that B wave on the hourly supports my theory. I have an excellent tramline pair with the upper tramline sporting two overshoots (not an unusual event in the gold charts). Last week, the market descended to the $1,150 level which touched tramline support.
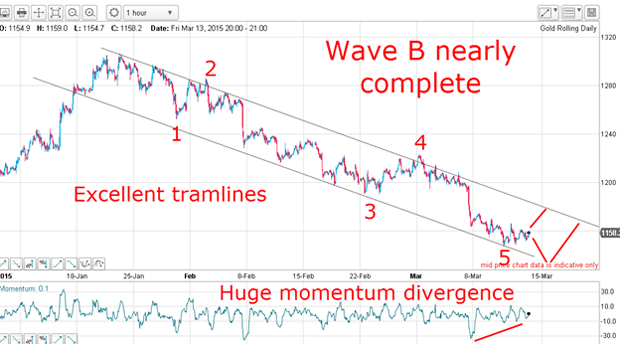
That was a possible long entry if wave 5 had indeed ended. Remember, fifth waves are ending waves. Also note the large positive-momentum divergence at the low a sign that a turn is on the cards.
So, are we any closer to a rally today?
The green line on the chart below represents resistance.
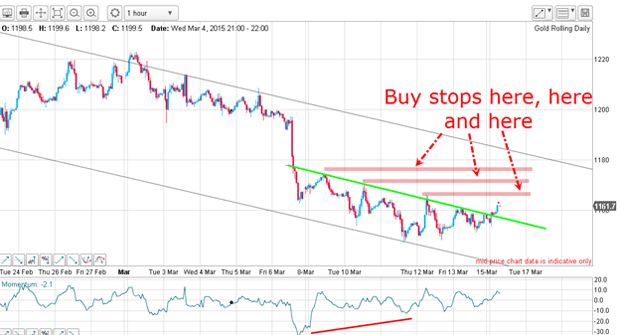
Overnight, the market has poked above this line, breaking the resistance.
Many shorts will have their protective buy stops lurking just above the recent highs (pink bars). Any move higher will touch these off like a Chinese firecracker and move the market smartly towards the upper tramline.
Remember, the market has been almost straight down off the January $1,300 high to the past week's $1,150 low a significant drop of $150. In that time, I expect bearish sentiment to have built up a head of steam after all, the talk has been that gold would soon drop to below $1,000.
Stocks are the only game in town and deflation is now here, depressing gold's allure as a traditional inflation hedge (though in reality it is nothing of the sort).
Here is the latest commitments of traders (COT) data, which is extremely revealing:
| (Contracts of 100 troy ounces) | Row 0 - Cell 1 | Row 0 - Cell 2 | Row 0 - Cell 3 | Open interest: 410,918 | ||||
| Commitments | ||||||||
| 171,821 | 89,929 | 43,257 | 154,578 | 243,920 | 369,656 | 377,106 | 41,262 | 33,812 |
| Changes from 03/03/15 (Change in open interest: 5,794) | ||||||||
| -8,740 | 25,188 | -901 | 14,498 | -19,547 | 4,857 | 4,740 | 937 | 1,054 |
| Percent of open in terest for each category of traders | ||||||||
| 41.8 | 21.9 | 10.5 | 37.6 | 59.4 | 90.0 | 91.8 | 10.0 | 8.2 |
| Number of traders in each category (Total traders: 307) | ||||||||
| 141 | 91 | 82 | 53 | 50 | 231 | 192 | Row 8 - Cell 7 | Row 8 - Cell 8 |
In the week 3 to 10 March, hedge funds (the non-commercials) reduced their long positions by 5%, but ramped up their shorts by a whopping 40%. I guess they couldn't resist the siren call of the gurus with their persuasive sub-$1,000 targets.
Note that the commercials (smart money) did the reverse and took a large swing to the long side; they now hold a ratio of about 1.5 shorts to longs. Included are the gold mines who traditionally hedge (sell forward) their output and are almost always heavily net short the futures. This very moderate 1.5 to one ratio is actually a very bullish sign. A long trade on gold seems to be the smart move.
Stay tuned...
Get the latest financial news, insights and expert analysis from our award-winning MoneyWeek team, to help you understand what really matters when it comes to your finances.
John is is a British-born lapsed PhD physicist, who previously worked for Nasa on the Mars exploration team. He is a former commodity trading advisor with the US Commodities Futures Trading Commission, and worked in a boutique futures house in California in the 1980s.
He was a partner in one of the first futures newsletter advisory services, based in Washington DC, specialising in pork bellies and currencies. John is primarily a chart-reading trader, having cut his trading teeth in the days before PCs.
As well as his work in the financial world, he has launched, run and sold several 'real' businesses producing 'real' products.
-
 Average UK house price reaches £300,000 for first time, Halifax says
While the average house price has topped £300k, regional disparities still remain, Halifax finds.
-
 Barings Emerging Europe trust bounces back from Russia woes
Barings Emerging Europe trust has added the Middle East and Africa to its mandate, delivering a strong recovery, says Max King