Gold is pushing for $1,800 – will it make it?
Gold's impressive rally has pushed hard for the key $1,800 milestone. But most traders are likely to be disappointed, says John C Burford. Here's why.
Get the latest financial news, insights and expert analysis from our award-winning MoneyWeek team, to help you understand what really matters when it comes to your finances.
You are now subscribed
Your newsletter sign-up was successful
Want to add more newsletters?

Twice daily
MoneyWeek
Get the latest financial news, insights and expert analysis from our award-winning MoneyWeek team, to help you understand what really matters when it comes to your finances.

Four times a week
Look After My Bills
Sign up to our free money-saving newsletter, filled with the latest news and expert advice to help you find the best tips and deals for managing your bills. Start saving today!
TABLE.ben-table TABLE {BORDER-BOTTOM: #2b1083 1px solid; BORDER-LEFT: #2b1083 1px solid; BORDER-TOP: #2b1083 1px solid; BORDER-RIGHT: #2b1083 1px solid}TH {TEXT-ALIGN: center; BORDER-LEFT: #a6a6c9 1px solid; PADDING-BOTTOM: 2px; PADDING-LEFT: 1px; PADDING-RIGHT: 1px; BACKGROUND: #2b1083; COLOR: white; FONT-SIZE: 0.8em; FONT-WEIGHT: bold; PADDING-TOP: 2px}TH.first {TEXT-ALIGN: left; BORDER-LEFT: 0px; PADDING-BOTTOM: 2px; PADDING-LEFT: 1px; PADDING-RIGHT: 1px; FONT-SIZE: 0.8em; PADDING-TOP: 2px}TR {BACKGROUND: #fff}TR.alt {BACKGROUND: #f6f5f9}TD {TEXT-ALIGN: center; BORDER-LEFT: #a6a6c9 1px solid; PADDING-BOTTOM: 2px; PADDING-LEFT: 1px; PADDING-RIGHT: 1px; COLOR: #000; FONT-SIZE: 0.8em; PADDING-TOP: 2px}TD.alt {BACKGROUND-COLOR: #f6f5f9}TD.bold {FONT-WEIGHT: bold}TD.first {TEXT-ALIGN: left}TD.left {TEXT-ALIGN: left}TD.bleft {TEXT-ALIGN: left; FONT-WEIGHT: bold}
OK, it's time for me to face the music on gold!
If you've been reading MoneyWeek Trader a while, you'll know I've been bearish on gold. But lately it's kept going up. In fact, this market has given me headaches for some time.
MoneyWeek
Subscribe to MoneyWeek today and get your first six magazine issues absolutely FREE

Sign up to Money Morning
Don't miss the latest investment and personal finances news, market analysis, plus money-saving tips with our free twice-daily newsletter
Don't miss the latest investment and personal finances news, market analysis, plus money-saving tips with our free twice-daily newsletter
I last wrote about gold on 29 August: Gold on a tear but for how much longer? Back then it was trading at the $1,670 area. A month on and it's in the $1,780 region a rise of $110 or 6.5%.
So the simple answer to that headline is: "Much longer!"
I can't deny it. The exponential rally over the past few months has been stunning. But can it make it through the tough $1,800 level? Let's have a look.
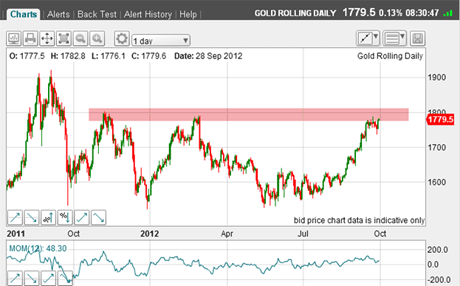
Here is the daily chart:
(Click on the chart for a larger version)
With that pink bar, I've indicated the large resistance zone surrounding the $1,800 level.
Yet again the gold market is dangerously bullish
It's clear that much of the buying has been inspired by visions of hyperinflation down the road. Many think this is assured by the promises of much more available liquidity from further QE operations by central banks.
In fact, the US Fed has promised unlimited' liquidity injections.
One of the problems with this rationale for me is the fact that everyone on the planet now knows Fed policy and therefore, the only surprise could be to the downside. There is no room for positive surprises with the word unlimited'!
Time and again, I have observed that after a stunning bull run, such as we have in gold, when a clear-cut bullish development occurs (Fed policy), then a major top is close at hand.
Of course, trader sentiment often indicates when a market is too one-sided. And by some measures, bullish sentiment has been running over 90%.
Here is the latest Commitments of Traders (COT) data:
| OPEN INTEREST: 478,609 | ||||||||
| COMMITMENTS | ||||||||
| 224,988 | 33,873 | 27,931 | 148,802 | 398,435 | 401,721 | 460,239 | 76,888 | 18,370 |
| CHANGES FROM 09/11/12 (CHANGE IN OPEN INTEREST: 18,078) | ||||||||
| 10,585 | 1,486 | -136 | 5,654 | 18,196 | 16,103 | 19,546 | 1,975 | -1,468 |
| PERCENT OF OPEN INTEREST FOR EACH CATEGORY OF TRADERS | ||||||||
| 47.0 | 7.1 | 5.8 | 31.1 | 83.2 | 83.9 | 96.2 | 16.1 | 3.8 |
| NUMBER OF TRADERS IN EACH CATEGORY (TOTAL TRADERS: 105) | ||||||||
| 216 | 57 | 72 | 45 | 50 | 289 | 159 | Row 8 - Cell 7 | Row 8 - Cell 8 |
Wow! The hedge funds (non-commercials) are massively long by a ratio of almost seven-to-one. Even the small specs' (non-reportable) long positions outnumber the shorts by more than four-to-one.
But look at the changes on the week the specs of all sizes have massively increased their long bets.
They are in danger of making one of the biggest errors in trading getting more bullish as the market is in one its exponential rally phases.
I can't pin-point the exact top, of course. Who can? But when the top is in, I can confidently state that the falls will be spectacular. Will the heavy resistance I show on the top chart turn this market around? I wonder
The other point is this. When it appears there is only one way for the market to go you just know the turn is at hand. This is the seeming perversity of markets.
A sign that the top could be near
OK, if I zoom in on the near-term chart, can I find any clues as to market direction?
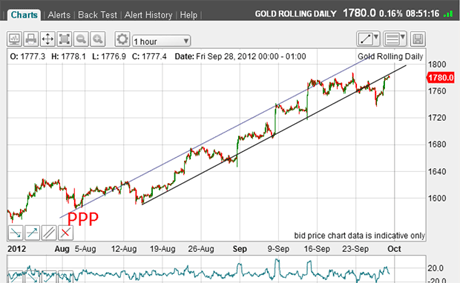
Here is the hourly:
(Click on the chart for a larger version)
I have a decent tramline pair with good touch-points, except for the two slight overshoots. Remember, gold is a highly emotional market and we must expect these.
The market has been climbing up these tramlines until Wednesday, when it broke heavily below the lower line. That was the first sign to me that a top was near.
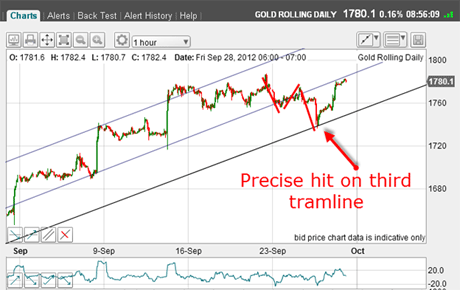
Let's draw in a third lower tramline:
(Click on the chart for a larger version)
The dip has a clear A-B-C form and the decline stopped precisely on my third tramline. Note the positive momentum divergence between the A and C wave lows a sign that the rally had not ended.
And it didn't hang around the third tramline for long!
This $1,800 level is key
This morning, the market is crawling up alongside the centre tramline. The question is: Will it push through or will it be rebuffed?
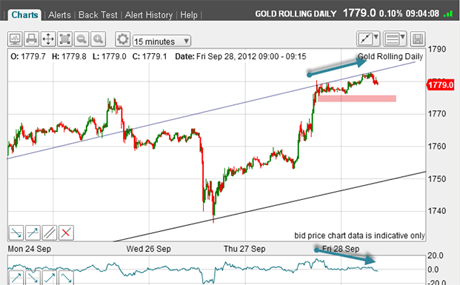
One of the things I look for when in this situation is this: I look for the nearest minor low and to set sell stops below this low. Here is the updated chart in close-up:
(Click on the chart for a larger version)
This 15-minute chart shows the most recent minor low (pink bar). There is also a budding negative momentum divergence (blue arrows), which is what I like to see.
So I have a potential set-up for a short trade where protective stops can be placed above the centre tramline.
Of course, the market may decide to make a lunge for the $1,800 level, which lies only $20 away.
But since this is a widely-touted target, it may not even get there.
The psychology here is interesting. The round number $1,800 is a common target where many long traders will be looking to take at least some profits. So if this level is missed, many will see their precious on-paper profits slip away.
They will then be tempted to get out while they can, grabbing the remaining profit. This selling would put added pressure on the market and the numbers can be huge.
Just look again at the COT data seven potential sellers for every buyer. Those odds are not what I would like on my side! This is exciting isn't it? Let us know your thoughts below.
If you're a new reader, or need a reminder about some of the methods I refer to in my trades, then do have a look at my introductory videos:
The essentials of tramline trading
An introduction to Elliott wave theory
Advanced trading with Elliott waves
Don't miss my next trading insight. To receive all my spread betting blog posts by email, as soon as I've written them, just sign up here . If you have any queries regarding MoneyWeek Trader, please contact us here.
Get the latest financial news, insights and expert analysis from our award-winning MoneyWeek team, to help you understand what really matters when it comes to your finances.
John is is a British-born lapsed PhD physicist, who previously worked for Nasa on the Mars exploration team. He is a former commodity trading advisor with the US Commodities Futures Trading Commission, and worked in a boutique futures house in California in the 1980s.
He was a partner in one of the first futures newsletter advisory services, based in Washington DC, specialising in pork bellies and currencies. John is primarily a chart-reading trader, having cut his trading teeth in the days before PCs.
As well as his work in the financial world, he has launched, run and sold several 'real' businesses producing 'real' products.
-
 Pension Credit: should the mixed-age couples rule be scrapped?
The mixed-age couples rule was introduced in May 2019 to reserve pension credit for older households but a charity warns it is unfair
-
 Average income tax by area: The parts of the UK paying the most tax mapped
The UK’s total income tax bill was £240.7 billion 2022/23, but the tax burden is not spread equally around the country. We look at the towns and boroughs that have the highest average income tax bill.