Gold is following my script
The crash in the gold price has been a great example of herd behaviour, says John C Burford. But now the bulls and the bears are fighting for supremacy - who will win?
Get the latest financial news, insights and expert analysis from our award-winning MoneyWeek team, to help you understand what really matters when it comes to your finances.
You are now subscribed
Your newsletter sign-up was successful
Want to add more newsletters?

Twice daily
MoneyWeek
Get the latest financial news, insights and expert analysis from our award-winning MoneyWeek team, to help you understand what really matters when it comes to your finances.

Four times a week
Look After My Bills
Sign up to our free money-saving newsletter, filled with the latest news and expert advice to help you find the best tips and deals for managing your bills. Start saving today!
I will continue with gold today. I hope to get to the equally interesting Dow and euro markets next week.
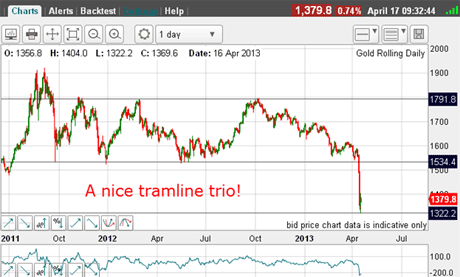
On Wednesday, I believe I made a good case for a rally off my lower tramline on the daily chart:

(Click on the chart for a larger version)
MoneyWeek
Subscribe to MoneyWeek today and get your first six magazine issues absolutely FREE

Sign up to Money Morning
Don't miss the latest investment and personal finances news, market analysis, plus money-saving tips with our free twice-daily newsletter
Don't miss the latest investment and personal finances news, market analysis, plus money-saving tips with our free twice-daily newsletter
As I write, the market is bouncing up off that level.
Just step back for a moment and consider the forecasting power of tramlines. I drew in the lower one days before the crash, so that I could forecast where the market was likely to reach if the centre line was breached.
Although this is a long-term chart, tramlines work equally well in shorter time frames. They are the backbone of my trading method.
But let me take a moment to comment on the state of the market at last week's $1,330 low.
Be sceptical of the media
As we all should know by now, it is the markets that make the news! We had one common explanation' for the collapsein heavy central bank sales including a conspiracy theory that the US Federal Reserve have been manipulating' the gold price since the 2011 top to prevent a run on the dollar.
Of course, I consider such theories to be utter rubbish. If we have a bullish market, any central bank offerings must be eagerly bought, surely? The price would likely rise on the news because the focus would be on the buyer, not the seller!
Also, there are many central banks in the world. Not all have the same need to either buy or sell gold at the same time.
And never forget central banks are awful market timers!
And in any case, accurate data on central bank sales if it exists at all is revealed well afterwards. In the moment, all is pure speculation and is used by those with a psychological need to find a reason that confirms their prior beliefs. And their belief that news drives the markets gets them into trouble time after time.
With the extreme negative mood surrounding gold at last week's low, the uninformed would likely be tempted to short the market usually right near the low!
Don't worry, in my early days, I did just that and paid the price.
A trader, on the other hand, needs to stand outside the herd and simply observe such behaviour and use it to make a judgment on which way to trade.
My general rule is simple: When sentiment becomes extreme following a strong up or down move, then look for reasons to trade against that move.
Of course, no one rings a bell when sentiment becomes extreme it is a judgment call. I use the commitments of traders(COT) data (last week's figures are due out later today) and the media.
On Wednesday, I gave a few good reasons to trade from the long side and take profits on any shorts - from the lower tramline hit, the very oversold daily momentum reading and the extremely bearish media coverage.
This was a trade very much against the mainstream. Take a look at the first chart. Now ask: Would I be catching a falling knife if I went long? Surely, a long trade is sheer madness. It goes against everything I know!
All I can say is that people who achieve in life are often considered mad, at first!
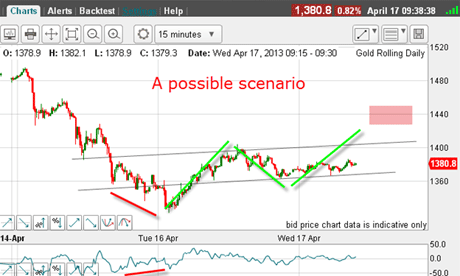
How to trade gold now?

(Click on the chart for a larger version)
It almost panned out that way, but a savage dip was in store before the promised land above $1,400.
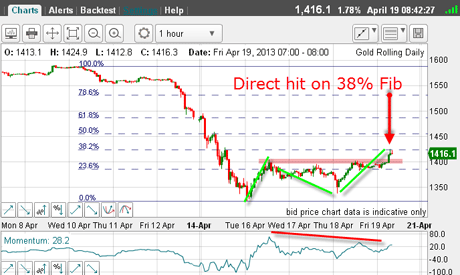
And as I write, this is the picture:

(Click on the chart for a larger version)
I still have my A-B-C rally, and the market has hit the Fibonacci 38% retrace today.
I suspected there would be many buy-stops taken out if the market could rally to the $1,400 level. It is apparent that overnight, this did occur. I have marked this area by the pink bar.
Many of these buy stops were placed there by the latecomers to the party who had jumped on the short wagon rather too late.
In gold over the years, I have noted that by anticipating where the stops are located, a trader can be well positioned for a winning swing trade.
With the market having hit a Fibonacci level and with a potential negative-momentum divergence between the A and C waves (red bar), this is a great place for taking a profit on long trades for a very tasty 500 600-pip profit, depending on the entry.
But is this a great place to reverse and go short?
There are factors in place hinting at that trade. After all, the market has taken out a lot of weak shorts above $1,400, and there will be many longs who see this rally as a godsend to get out with a muchsmaller loss than at £1,330.
The market has carried $90 above that low in just a few days.
So now, with this sharp rally, we have both the longs and shorts worried! Until Tuesday, everyone knew the market was in freefall no debate there.
But now, the picture is much more muddled and in these conditions, we should see sharp swings up and down as the bulls and bears fight for supremacy. This is a time to be very nimble or to trade in smaller size or even to exit the market until the dust settles.
If you're a new reader, or need a reminder about some of the methods I refer to in my trades, then do have a look at my introductory videos:
The essentials of tramline trading Advanced tramline trading An introduction to Elliott wave theory Advanced trading with Elliott waves Trading with Fibonacci levels Trading with 'momentum' Putting it all together
Don't miss my next trading insight. To receive all my spread betting blog posts by email, as soon as I've written them, just sign up here . If you have any queries regarding MoneyWeek Trader, please contact us here.
Get the latest financial news, insights and expert analysis from our award-winning MoneyWeek team, to help you understand what really matters when it comes to your finances.
John is is a British-born lapsed PhD physicist, who previously worked for Nasa on the Mars exploration team. He is a former commodity trading advisor with the US Commodities Futures Trading Commission, and worked in a boutique futures house in California in the 1980s.
He was a partner in one of the first futures newsletter advisory services, based in Washington DC, specialising in pork bellies and currencies. John is primarily a chart-reading trader, having cut his trading teeth in the days before PCs.
As well as his work in the financial world, he has launched, run and sold several 'real' businesses producing 'real' products.
-
 Can mining stocks deliver golden gains?
With gold and silver prices having outperformed the stock markets last year, mining stocks can be an effective, if volatile, means of gaining exposure
-
 8 ways the ‘sandwich generation’ can protect wealth
People squeezed between caring for ageing parents and adult children or younger grandchildren – known as the ‘sandwich generation’ – are at risk of neglecting their own financial planning. Here’s how to protect yourself and your loved ones’ wealth.