Gold is correcting, as forecast
Gold is following John C Burford's roadmap nicely. Here, he takes a look at where it might go from here.
Get the latest financial news, insights and expert analysis from our award-winning MoneyWeek team, to help you understand what really matters when it comes to your finances.
You are now subscribed
Your newsletter sign-up was successful
Want to add more newsletters?

Twice daily
MoneyWeek
Get the latest financial news, insights and expert analysis from our award-winning MoneyWeek team, to help you understand what really matters when it comes to your finances.

Four times a week
Look After My Bills
Sign up to our free money-saving newsletter, filled with the latest news and expert advice to help you find the best tips and deals for managing your bills. Start saving today!
In my previous article on gold on 9 March, I laid out my case that gold was very probably due a pullback from the stunning two-month $200 rally off the December lows.
I based my case on the reading of my headline indicator (HI) as well as the wave structure. This is what I wrote: "Today, with every shoeshine boy and his dog now tipping gold, my question is this: is gold due an imminent pull-back? And if so, how low is it likely to go?
"In other words, have too many bulls jumped over to one side of the boat leaving it in danger of capsizing?"
MoneyWeek
Subscribe to MoneyWeek today and get your first six magazine issues absolutely FREE

Sign up to Money Morning
Don't miss the latest investment and personal finances news, market analysis, plus money-saving tips with our free twice-daily newsletter
Don't miss the latest investment and personal finances news, market analysis, plus money-saving tips with our free twice-daily newsletter
Since I wrote those words, I have noted a sharp increase in forecasts from the pundits for gold to reach levels way above the old $1,920 high. In fact, I did see targets mentioned at $2,500 and even $3,000 levels. That really sent my HI needle hard to the right.
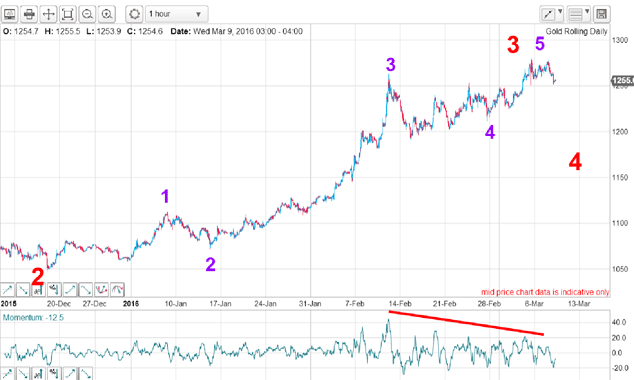
This was the chart I showed back then:

The rally off the December $1,050 lows has several significant features. The main part of the rally is a third (red) wave, which contains its own complete five up (purple) with a textbook negative momentum divergence at the wave 5 high at the $1,280 level.
The clear implication was that if there were to be no more subdivisions higher, the market would start a decline in red wave 4 to correct the extreme bullish enthusiasm that had built up.
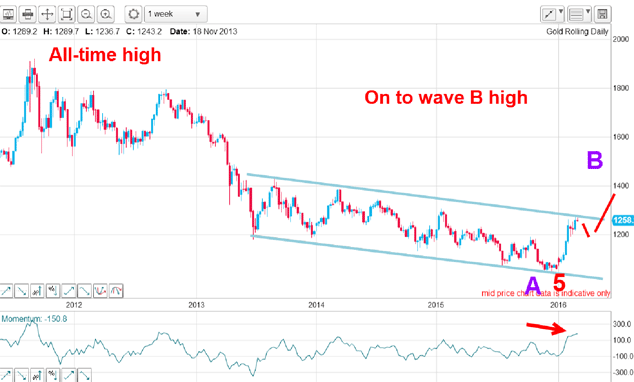
To put this into the bigger picture, here is the chart I showed of the decline off the 2011 all-time highs at $1,920:

My blue tramlines are OK, but not textbook. That is why I have them only pencilled in at present. But with the market having hit the $1,280 level which lies at the upper tramline and if the market has indeed started a correction, my belief in these tramlines as lines of support (lower) and resistance (upper) will be boosted.
That is my roadmap a decline and then a push higher to overcome the resistance at the $1,280 level in a very large B wave.
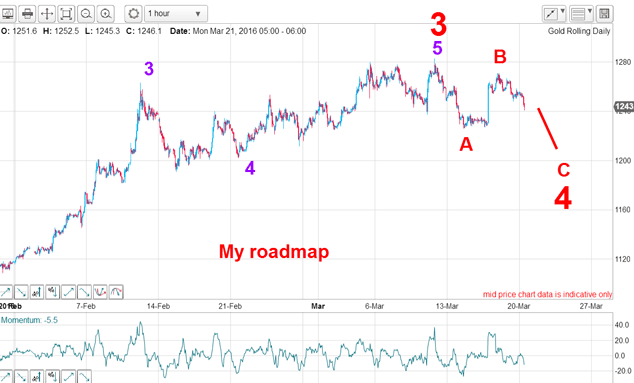
But in the shorter term, how is my forecast panning out? Here is the latest hourly chart:

My wave 5 of three just poked above the $1,280 level on 11 March and then declined in wave A. Following the US Federal Reserve's decision to go soft on interest rate rises last Wednesday, the market rallied to the wave B high, which did not reach the previous high.
This morning, it is falling again in my wave C. The market is following my roadmap very accurately.
On 9 March, I made a bold forecast that the market had a chance to decline to the $1,200 area. With gold trading around the $1,270 level, that must have seemed very unlikely to most.
As I pointed out, at the December lows the hedge funds were massively short, and their short covering in January and February helped propel the two-month $200 rally. So how have they behaved since I last wrote? Here is the latest Commitments of Traders (COT) data as of last Tuesday:
| Contracts of 100 Troy ounces | Row 0 - Cell 1 | Row 0 - Cell 2 | Open interest: 761,367 | |||||
| Commitments | ||||||||
| 266,517 | 63,095 | 221,725 | 218,545 | 438,450 | 370,832 | 723,270 | 54,850 | 38,367 |
| Changes from 8/3/16 (Change in open interest: -26,773) | ||||||||
| -14,162 | -4,728 | -4,818 | -3,516 | -17,152 | -22,429 | -26,698 | -4,277 | -75 |
| Percent of open interest for each category of traders | ||||||||
| 35.0 | 8.3 | 29.1 | 28.7 | 57.6 | 92.8 | 95.0 | 7.2 | 5.0 |
| Number of traders in each category (Total traders: 401) | ||||||||
| 220 | 99 | 146 | 56 | 66 | 323 | 269 | Row 8 - Cell 7 | Row 8 - Cell 8 |
They remain solidly bullish with a ratio of 4.2 to 1 bulls to bears. That is still tilting the vessel hard to one side, and I expect more movement to right the ship before the correction is over.
Nevertheless, the market is heading towards my target of $1,200 (give or take). As I have mentioned before, gold is a very spiky market and it would not surprise me to see a final spike low (to somewhere below the $1,200 level?) before the bull run can resume.
That low may well be accompanied by very bearish headlines such as "RIP gold bulls gold plunges below $1,200". And that is when my HI will really perk up.
Get the latest financial news, insights and expert analysis from our award-winning MoneyWeek team, to help you understand what really matters when it comes to your finances.
John is is a British-born lapsed PhD physicist, who previously worked for Nasa on the Mars exploration team. He is a former commodity trading advisor with the US Commodities Futures Trading Commission, and worked in a boutique futures house in California in the 1980s.
He was a partner in one of the first futures newsletter advisory services, based in Washington DC, specialising in pork bellies and currencies. John is primarily a chart-reading trader, having cut his trading teeth in the days before PCs.
As well as his work in the financial world, he has launched, run and sold several 'real' businesses producing 'real' products.
-
 Average UK house price reaches £300,000 for first time, Halifax says
While the average house price has topped £300k, regional disparities still remain, Halifax finds.
-
 Barings Emerging Europe trust bounces back from Russia woes
Barings Emerging Europe trust has added the Middle East and Africa to its mandate, delivering a strong recovery, says Max King