Gold follows my roadmap down (for now)
Elliott wave theory has provided John C Burford with some solid clues to gold's future price direction.
Get the latest financial news, insights and expert analysis from our award-winning MoneyWeek team, to help you understand what really matters when it comes to your finances.
You are now subscribed
Your newsletter sign-up was successful
Want to add more newsletters?

Twice daily
MoneyWeek
Get the latest financial news, insights and expert analysis from our award-winning MoneyWeek team, to help you understand what really matters when it comes to your finances.

Four times a week
Look After My Bills
Sign up to our free money-saving newsletter, filled with the latest news and expert advice to help you find the best tips and deals for managing your bills. Start saving today!
One of the terrific advantages of getting to grips with basic Elliott wave theory is that with that understanding, you can place labels on the waves that give solid clues as to future price direction.
I do understand that many traders wrestle with this theory and its study can verge on the downright nit-picking of every tick. But my advice is to stick with the basics, as I show in these articles. The key message is that motive waves (in the main trend) have five waves in the main direction and then a correction in three waves in the opposite direction.
This is being played out in gold as I write. With experience, it is relatively straightforward to identify the waves, especially the third wave. These are usually long and strong and stand out on the chart.
MoneyWeek
Subscribe to MoneyWeek today and get your first six magazine issues absolutely FREE

Sign up to Money Morning
Don't miss the latest investment and personal finances news, market analysis, plus money-saving tips with our free twice-daily newsletter
Don't miss the latest investment and personal finances news, market analysis, plus money-saving tips with our free twice-daily newsletter
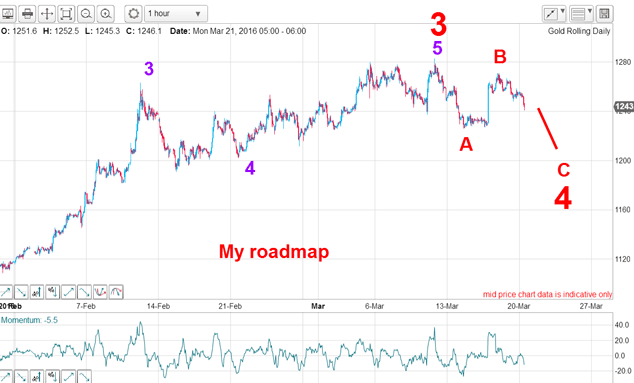
That is what I showed in my articleof 21 March with this chart:

The recent $1,280 high is my red wave 3 as well as the smaller-scale purple wave 5. That combination told me that a decline was due in the form of an A-B-C (or some variation). Fourth waves can be very complex, and I was prepared for anything the market threw at me.
Ideally, I would like to see wave C extend below the wave A lows and terminate somewhere in the $1,200 area (or a little below). I would also like to see a momentum divergence at the C wave low.
I arrived at that $1,200 target from the observation that A-B-C corrections to a main trend often terminate in the region of the previous fourth wave low in this case, the purple wave 4 low in February.
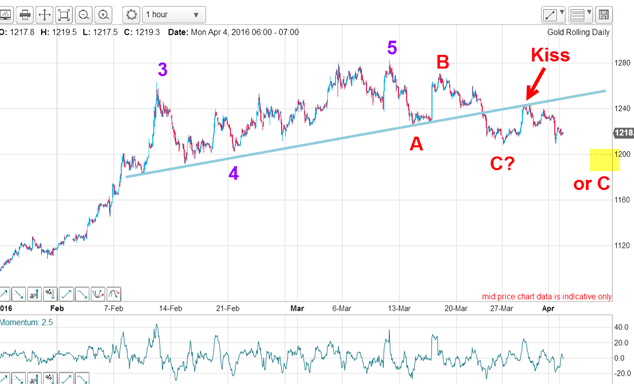
This is the above hourly chart updated:

I have a super blue trendline that connects several accurate hits on lows with the break and kiss. Before the break, the line was support and the kiss has shown that it is now resistance. And the kiss allowed a short sale at low risk, if desired.
Now, the market is deciding whether to put in a new wave C low or not.
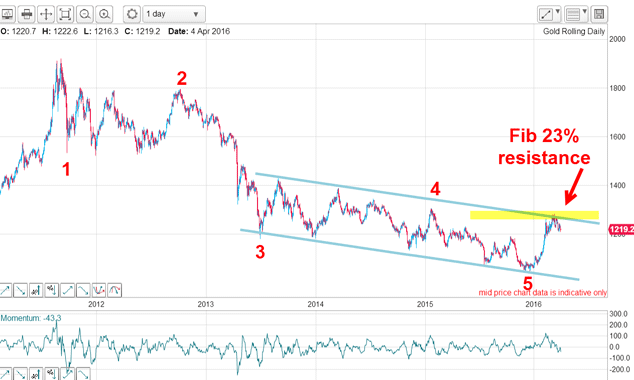
Here is the long-range chart showing my tramlines:

The rally to the $1,280 high took it right to the 23% retrace of the entire move down off the 2011 high another area of resistance. This was another reason to take at least partial profits on any long positions.
But so far, the low in this decline is only $1,210 which is close to my stated target, but I have a feeling it will be exceeded. After all, the commitments of traders (COT) data still shows a large plurality of longs to shorts held by hedge funds.
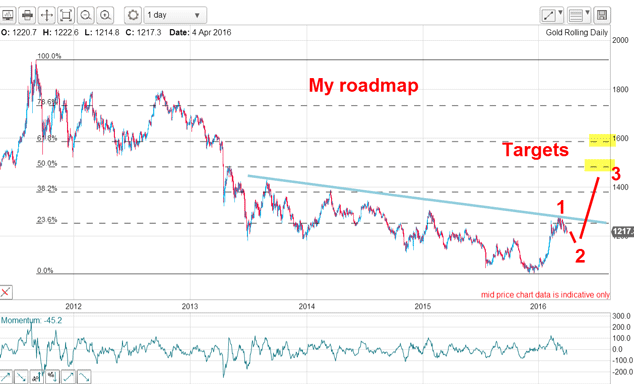
When my C wave terminates, I expect a very vigorous rally phase in a third wave. Here is my roadmap:

We are currently in wave 2 of what should be a five wave advance to much higher levels. My main target options are the Fibonacci 50% and 62% levels at $1,500 and $1,600. And a strong rally up past the blue tramline will confirm this picture.
Only a move below the December lows would cause me to reassess. But as ever, I will constantly challenge this roadmap against what the market throws at me.
Get the latest financial news, insights and expert analysis from our award-winning MoneyWeek team, to help you understand what really matters when it comes to your finances.
John is is a British-born lapsed PhD physicist, who previously worked for Nasa on the Mars exploration team. He is a former commodity trading advisor with the US Commodities Futures Trading Commission, and worked in a boutique futures house in California in the 1980s.
He was a partner in one of the first futures newsletter advisory services, based in Washington DC, specialising in pork bellies and currencies. John is primarily a chart-reading trader, having cut his trading teeth in the days before PCs.
As well as his work in the financial world, he has launched, run and sold several 'real' businesses producing 'real' products.
-
 Average UK house price reaches £300,000 for first time, Halifax says
While the average house price has topped £300k, regional disparities still remain, Halifax finds.
-
 Barings Emerging Europe trust bounces back from Russia woes
Barings Emerging Europe trust has added the Middle East and Africa to its mandate, delivering a strong recovery, says Max King