The FTSE 100 is in no man’s land
It's not always easy to make sense of volatile markets, says John C Burford. That can be dangerous for swing traders.
Get the latest financial news, insights and expert analysis from our award-winning MoneyWeek team, to help you understand what really matters when it comes to your finances.
You are now subscribed
Your newsletter sign-up was successful
Want to add more newsletters?

Twice daily
MoneyWeek
Get the latest financial news, insights and expert analysis from our award-winning MoneyWeek team, to help you understand what really matters when it comes to your finances.

Four times a week
Look After My Bills
Sign up to our free money-saving newsletter, filled with the latest news and expert advice to help you find the best tips and deals for managing your bills. Start saving today!
During the lively webinar that I gave for Trade for Profit members yesterday, I had a request from Matt to analyse the FTSE chart. He said that the market had been whipsawing around since June 2013 and has created a chart that looks like a dream for swing traders'.
Well, I look upon whipsawing charts with horror, not anticipation! It is so tricky to align yourself with the sudden zigs and zags that's what makes swing trading so tough.
However, more short-term trading, such as day trading, can actually be more rewarding in these conditions.
MoneyWeek
Subscribe to MoneyWeek today and get your first six magazine issues absolutely FREE

Sign up to Money Morning
Don't miss the latest investment and personal finances news, market analysis, plus money-saving tips with our free twice-daily newsletter
Don't miss the latest investment and personal finances news, market analysis, plus money-saving tips with our free twice-daily newsletter
So today, I thought I would perform my usual analysis on the FTSE using my tramline methods, because it does illuminate a very important principle of tramlines: when tramlines conflict, a no man's land appears.
Timing is everything for swing traders

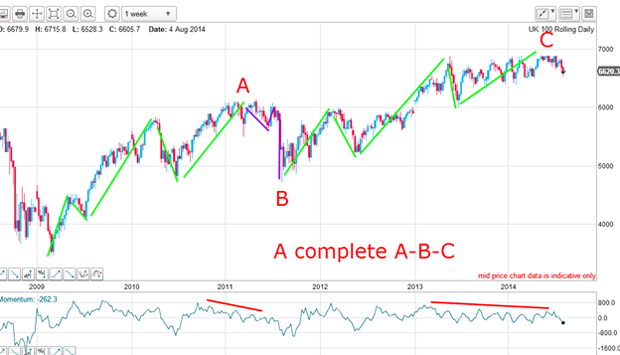
I have a clear large-scale A-B-C with both A and C waves sporting complete impulsive five-wave patterns. Remember, when a five-wave impulse terminates, the next move is opposite that trend.
My B wave is also pure textbook, containing a clear three wave A-B-C pattern.
Also, note the momentum divergences at the final fifth waves of A and C, indicating a lessening of buying power to the tops lasting many weeks.
Under this interpretation, the market has completed its relief rally off the 2009 low and is heading down in a new trend. Therefore, the correct trading stance is to look to trade short. But in swing trading, correct timing is critical.
For relative beginners, it is so easy to get swept up with your superb analysis and confidently sell the market with no plan! That is the road to ruin when dealing with these leveraged markets.
The market keeps hitting a brick wall

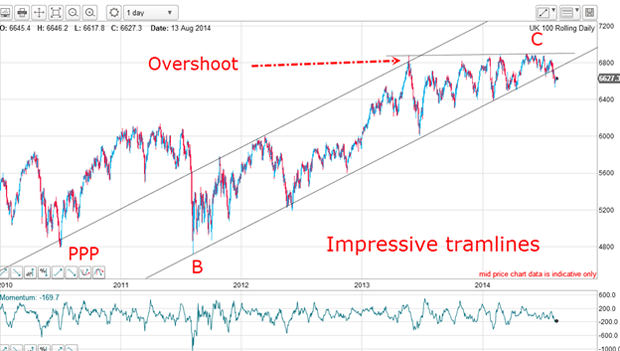
My next task is to find suitable tramlines and here they are. The lower tramline practically drew itself with the lows lining up almost perfectly on a straight line. Remember, this line has spanned three and a half years. Isn't that impressive? For the market to remember where support is located after three years is surely remarkable.
My upper tramline is pretty good and my PPP (prior pivot point) has a small overshoot. But the important overshoot is the one in 2013. An overshoot of the upper line indicates that the buying power has exhausted in that final flourish and to expect a big swoop down as sellers take over.
And that is precisely what occurred with the market reversing smack on the lower tramline! What a superb opportunity to trade with the uptrend.
But for the past year, the market has been zig-zagging in a general upward direction. Every time it has reached the 6,900 level, it has hit a brick wall and retreated. There is massive resistance at this level.
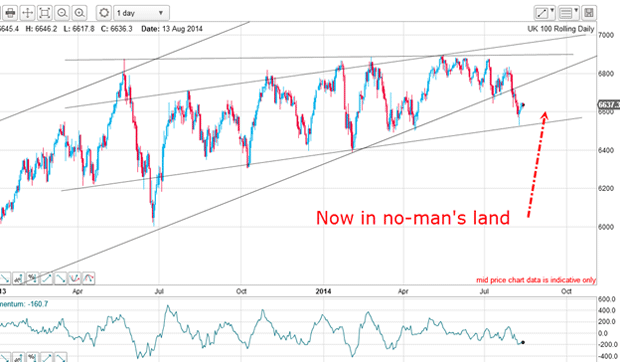
Also note the wedge pattern I can draw, and its break on 31 July signalled a break of the major tramline and a trend reversal.
No man's land: The place between support and resistance

Since July 2013, the market has been in true whipsaw mode. But I can draw excellent tramlines over the highs and lows! Under these tramlines, the market bounced off the support provided by the lower line last Friday and is heading up as I write.
Now the market is trading under the major long-term tramline, but above the short-term lower tramline in an area I will call no man's land'. It lies between support and resistance.
If the market can rally further, it could make it to the underside of the major tramline and plant a kiss. It would then be open to head down in a scalded-cat bounce. If this occurs, and the new lower tramline can be broken, that would signal the bear market was in full flow.
Which way will the market go next?

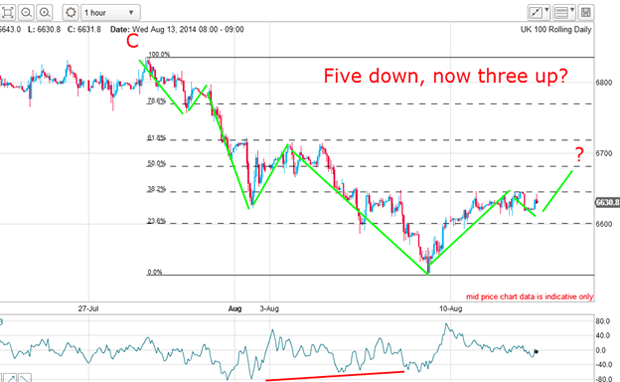
This is the move off the C wave high and there is a clear motive five-wave theme. My third wave is long and strong and the fifth wave is extended (a very common feature in today's markets) with its own five sub-wave pattern. This confirms the new down trend.
With the bounce off my lower tramline and the positive-momentum divergence there, a relief rally was set up. The most common form to this rally is an A-B-C. So far, the market has shot straight up in a likely A wave with the current pause around the Fibonacci 38% level providing a shallow B wave, so far.
My short-term expectation is for a C wave to be put in above the 38% level, although resistance at this level is very stiff (count the number of repulses). But breaking it could provide the boost needed to produce the tramline kiss on the long-term tramline above the 6,700 level. A realistic target under this scenario is the 6,700 6,800 area.
Of course, if the major trend really has turned down, rallies should be short-lived and the big moves will be to the downside.
Get the latest financial news, insights and expert analysis from our award-winning MoneyWeek team, to help you understand what really matters when it comes to your finances.
John is is a British-born lapsed PhD physicist, who previously worked for Nasa on the Mars exploration team. He is a former commodity trading advisor with the US Commodities Futures Trading Commission, and worked in a boutique futures house in California in the 1980s.
He was a partner in one of the first futures newsletter advisory services, based in Washington DC, specialising in pork bellies and currencies. John is primarily a chart-reading trader, having cut his trading teeth in the days before PCs.
As well as his work in the financial world, he has launched, run and sold several 'real' businesses producing 'real' products.
-
 UK interest rates live: rates held at 3.75%
The Bank of England’s Monetary Policy Committee (MPC) met today to decide UK interest rates, and voted to hold rates at their current level
-
 MoneyWeek Talks: The funds to choose in 2026
Podcast Fidelity's Tom Stevenson reveals his top three funds for 2026 for your ISA or self-invested personal pension