Finding Fibonacci in various markets
Fibonacci lines are a vital tool in finding low-risk entry points in your spread betting, says John C Burford. Here, he shows how they can be used in any market.
Get the latest financial news, insights and expert analysis from our award-winning MoneyWeek team, to help you understand what really matters when it comes to your finances.
You are now subscribed
Your newsletter sign-up was successful
Want to add more newsletters?

Twice daily
MoneyWeek
Get the latest financial news, insights and expert analysis from our award-winning MoneyWeek team, to help you understand what really matters when it comes to your finances.

Four times a week
Look After My Bills
Sign up to our free money-saving newsletter, filled with the latest news and expert advice to help you find the best tips and deals for managing your bills. Start saving today!
Today I go off-piste and show a few markets where Fibonacci retracements have pinpointed great trade entries. This should help any trader spot low-risk trades.
As you know, I love using my Fibonacci tool and will apply it whenever I suspect there has been a recent turn which gives me the second pivot point.I do this on any timeframe chart.
Let me give a few examples.
MoneyWeek
Subscribe to MoneyWeek today and get your first six magazine issues absolutely FREE

Sign up to Money Morning
Don't miss the latest investment and personal finances news, market analysis, plus money-saving tips with our free twice-daily newsletter
Don't miss the latest investment and personal finances news, market analysis, plus money-saving tips with our free twice-daily newsletter
Nikkei versus Dow
The Nikkei is a widely traded index of major Japanese shares. It is considered the Dow Jones Industrial Index of Japan. You would think that since the world's major economies are globalised and inter-connected that the world's stock markets would move more or less in synch.After all, a slowdown in the USA and Europe should result in a similar move in Japan and China as these countries are export-driven.
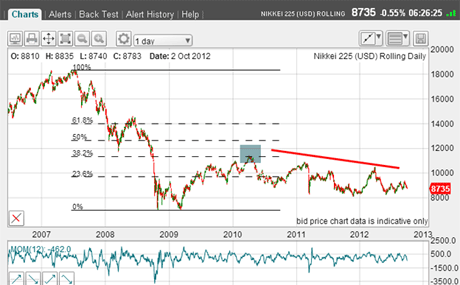
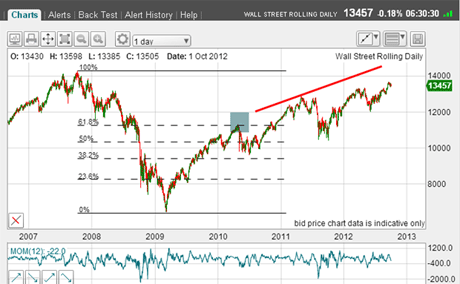
But compare the Nikkei with the Dow on these daily charts going back to the pre-credit crunch days:
(Click on the chart for a larger version)
(Click on the chart for a larger version)
Following the 2007-2009 collapse, the Nikkei managed to rally to the exact 38% Fibonacci level (blue bar) and had declined ever since. That was agreat place to short the Nikkei.
In the Dow, we saw a similar collapse, but the Dow rallied to a deeper 62% Fibonacci retrace before hitting resistance. That was also a great place for a short trade.But here, the Dow has rallied, unlike the Nikkei. Maybe markets are not so inter-connected after all.
Let's take a look at recent action in the Nikkei:
(Click on the chart for a larger version)
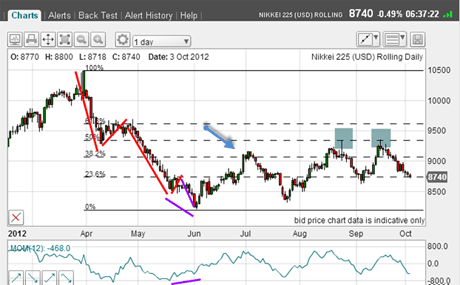
The decline off the April peak is a clear five-wave affair complete with a positive momentum divergence at the wave 5 low.That is pure textbook and indicates the main trend is down.
But when you see this pattern, you know a rally lies ahead and it becomes a good idea to cover shorts.
The first rally carried to the Fibonacci 38% retrace (blue arrow) and after a series of overlapping waves (indicating a likely pause in the bear market), the market made two stabs at the Fibonacci 50% level (blue bars) and is currently challenging recent market lows.
The rallies to the 50% level were ideal places to enter short trades, of course.
I find that the shallow 38% retraces normally indicate a prompt resumption in the downtrend, while the 50% and deeper retraces normally indicate more work before the bear market can get back on track.
EUR versus USD
The euro has been in a bear market for some time, but with a recent large correction.
(Click on the chart for a larger version)
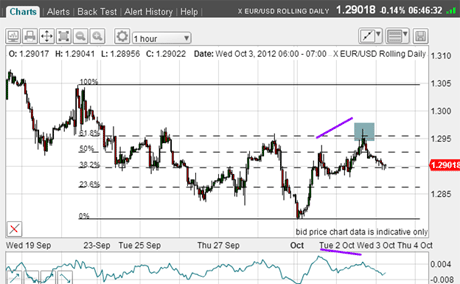
Following Monday's 1.28 low a new low for the move - the market this week has rallied in a clear A-B-C form (indicating a correction), and the market made it back to the Fibonacci 62% retrace with a slight overshoot (purple bar).
These pigtails' are quite common and usually mark the end of the move.
Again, a short trade at the 62% area was indicated.
And finally
GBP versus USD
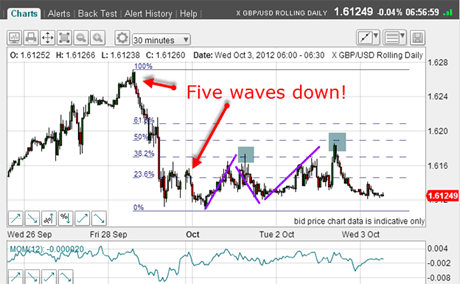
This market has been swinging wildly recently with no clear direction, and here is the action over the past few days:
(Click on the chart for a larger version)
From Friday's high, the decline occurred in five waves: with a nice positive momentum divergence at wave 5; then a rally to the 36% Fibonacci level; then a dip; and then a run up to the 50% level.This last run completed a nice A-B-C (purple lines) corrective pattern.
The odds favour a declining market, which would be confirmed by a move below Monday's low and in fact as I write, this move has just occurred in the past minute!
In these posts, what I write can very quickly become out of date!
But I hope you can see that using these simple ideas could give you terrific low-risk trade entries.
If you're a new reader, or need a reminder about some of the methods I refer to in my trades, then do have a look at my introductory videos:
The essentials of tramline trading
An introduction to Elliott wave theory
Advanced trading with Elliott waves
Don't miss my next trading insight. To receive all my spread betting blog posts by email, as soon as I've written them, just sign up here . If you have any queries regarding MoneyWeek Trader, please contact us here.
Get the latest financial news, insights and expert analysis from our award-winning MoneyWeek team, to help you understand what really matters when it comes to your finances.
John is is a British-born lapsed PhD physicist, who previously worked for Nasa on the Mars exploration team. He is a former commodity trading advisor with the US Commodities Futures Trading Commission, and worked in a boutique futures house in California in the 1980s.
He was a partner in one of the first futures newsletter advisory services, based in Washington DC, specialising in pork bellies and currencies. John is primarily a chart-reading trader, having cut his trading teeth in the days before PCs.
As well as his work in the financial world, he has launched, run and sold several 'real' businesses producing 'real' products.
-
 Average UK house price reaches £300,000 for first time, Halifax says
While the average house price has topped £300k, regional disparities still remain, Halifax finds.
-
 Barings Emerging Europe trust bounces back from Russia woes
Barings Emerging Europe trust has added the Middle East and Africa to its mandate, delivering a strong recovery, says Max King