Fibonacci rules the Nikkei
The Fibonacci trading method is one of the most useful tools available to traders. To see why, look no further than the recent activity in Japan’s Nikkei index, says John C Burford.
Get the latest financial news, insights and expert analysis from our award-winning MoneyWeek team, to help you understand what really matters when it comes to your finances.
You are now subscribed
Your newsletter sign-up was successful
Want to add more newsletters?

Twice daily
MoneyWeek
Get the latest financial news, insights and expert analysis from our award-winning MoneyWeek team, to help you understand what really matters when it comes to your finances.

Four times a week
Look After My Bills
Sign up to our free money-saving newsletter, filled with the latest news and expert advice to help you find the best tips and deals for managing your bills. Start saving today!
I will be visiting Pisa next month, the birthplace of Leonard of Pisa, otherwise known as Fibonacci. It will be more of a pilgrimage since traders, myself very much included, owe so much to him. This chart of the Nikkei shows exactly why, as I will explain.
I have a video tutorial on how I use Fibonacci's ideas, and if you wish to explore this great man's life and works, I heartily recommend the monograph, Leonard of Pisa and the New Mathematics of the Middle Ages, by J and F Gies.
I have been watching the Nikkei since late last year, when it broke above long-term resistance:
MoneyWeek
Subscribe to MoneyWeek today and get your first six magazine issues absolutely FREE

Sign up to Money Morning
Don't miss the latest investment and personal finances news, market analysis, plus money-saving tips with our free twice-daily newsletter
Don't miss the latest investment and personal finances news, market analysis, plus money-saving tips with our free twice-daily newsletter
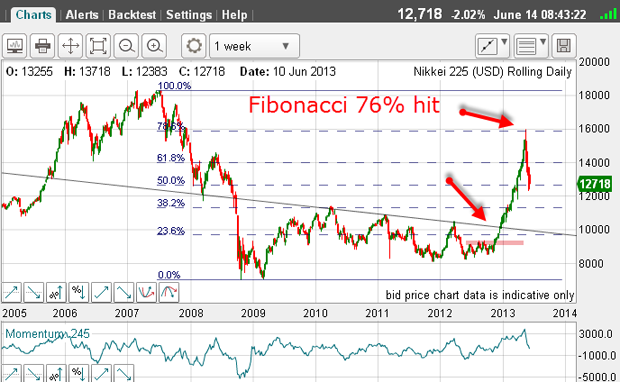
The first resistance zone to give way was the pink bar, and then when it broke above the splendid trendline (red arrow), that was the clincher that said we could be in for a wild ride to the upside.
Of course, the reason' for the huge rally in 2013 is Abenomics' - a plan to deliberately weaken the yen. But back then, this was not on anyone's radar except perhaps insiders privy to these government plans.
For most of us who have no insider connections, we must rely on what the charts are telling us. But those signals were clear a rally was very likely, and something was going on underneath the radar.
Why I advised selling Japanese shares
But sure enough, with the rapidly weakening yen (that was my 'trade for 2012'), more investors jumped on board as they saw the future the Japanese economy would be pulled out of the entrenched deflation and companies' margins would rocket as their selling prices would rise in the inflationary economy.
As reference to the commitments of traders (COT) data would show, the bullish mania was extreme with bulls at over six to one at some stages.
This bullish mania reached a peak on 22 May (remember that date?) when the Nikkei rose to the 16,000 level an almost 100% rise on the 2012 lows.
But note what this 16,000 level represented an exact Fibonacci 76% retrace of the big bear market of 2007 2007/2008.
Score a very big one for Sr Fibonacci.
That Fibonacci hit on hugely overbought momentum was the reason I advised selling Japanese shares then.
The Fibonacci retraces
OK, let's focus on the reversal from the 22 May high, as the waves are all following Fibonacci retraces, as I will show.
Let's start from the first lows after the 22 May high and progress to this morning:
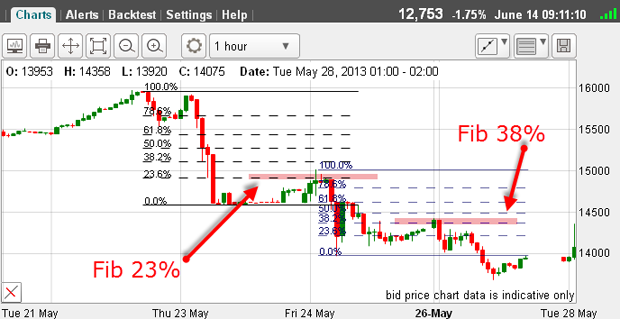
Here are two excellent Fibonacci retraces. Often, we see a slight overshoot (or undershoot) in a pigtail' on a candle, as in the first wave down. We shouldn't expect an exact hit every time, although we do see a good number of these.
Score two more for Sr Fibonacci.
And here are two more:
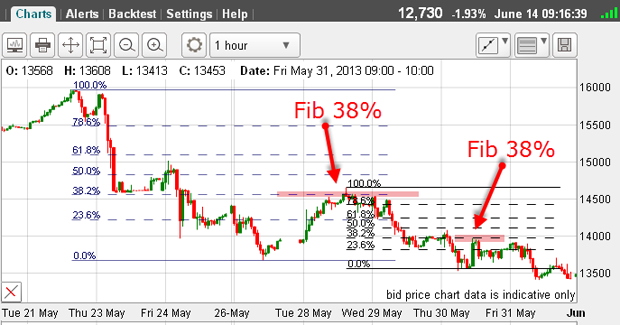
For the first example, I have used the May 22 high as top pivot point and the 27 May low as low pivot point.
Remember, you can fix your low pivot points whenever you see a budding rally off that low. The earlier you can identify this, the earlier you can spot a possible short entry point.
And here is the next rally:
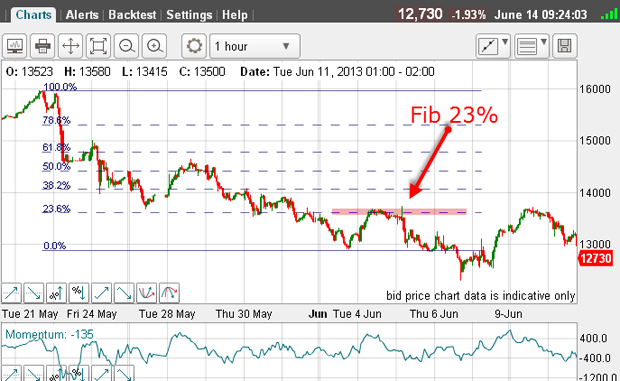
A nice Fibonacci 23% hit.
Here is the next:
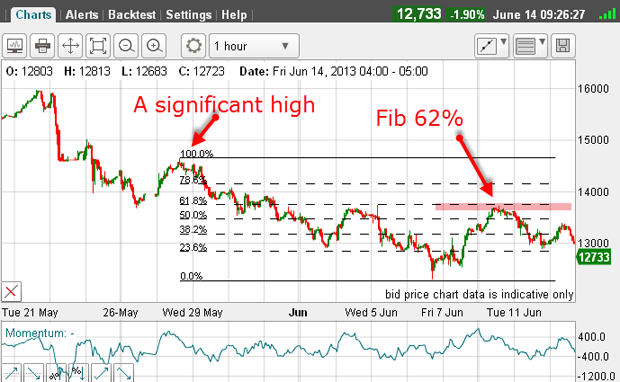
Here, I have used the significant high of 28 May as the top pivot point.
Another one for Sr Fibonacci!
And here are two more Fibonacci 62% retraces:
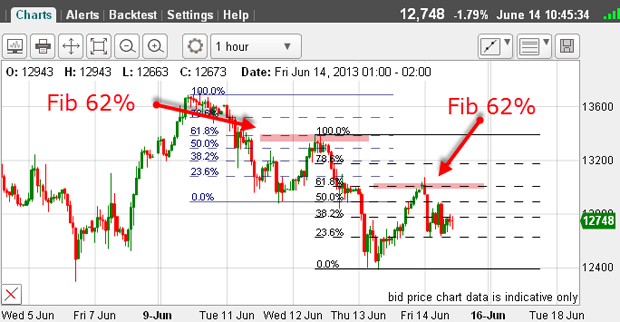
And that is not all!
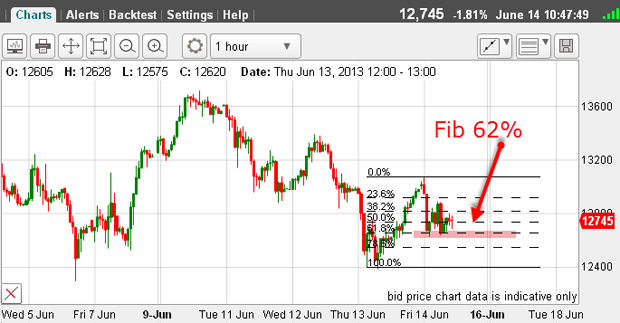
This is the latest wave from yesterday's low to the overnight high and the retrace is a perfect Fibonacci 62% - again!
I have lost count of these Fibonacci retraces and that is from the 22 May high: a space of only three weeks!
What's next for the Nikkei?
And each one of these retraces has been a possible trade entry point.
The market is in an established downtrend.
But let's go back to the long-term chart. Remember, with the yen strengthening, the Nikkei has plunged over 20% in three weeks (making it an official' bear market) one of the most rapid losses of value I can remember.
The sentiment has turned very bearish on the Nikkei.
So does this mean we should be looking for a big bounce?
Here are the Fibonacci levels drawn on this decline:
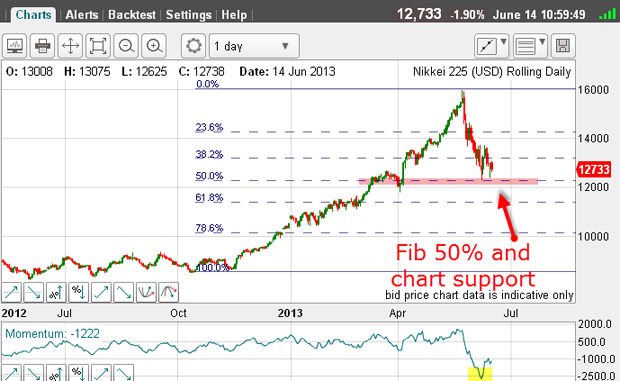
We have hit the Fibonacci 50% level and on oversold momentum (yellow highlight).
So this would be an excellent time to stage an unexpected' rally and a place to look to exit short positions.
If we get a rally, the short squeeze will be intense, as the boat is overloaded with shorts it is a very crowded trade.
Get the latest financial news, insights and expert analysis from our award-winning MoneyWeek team, to help you understand what really matters when it comes to your finances.
John is is a British-born lapsed PhD physicist, who previously worked for Nasa on the Mars exploration team. He is a former commodity trading advisor with the US Commodities Futures Trading Commission, and worked in a boutique futures house in California in the 1980s.
He was a partner in one of the first futures newsletter advisory services, based in Washington DC, specialising in pork bellies and currencies. John is primarily a chart-reading trader, having cut his trading teeth in the days before PCs.
As well as his work in the financial world, he has launched, run and sold several 'real' businesses producing 'real' products.
-
 ISA fund and trust picks for every type of investor – which could work for you?
Whether you’re an ISA investor seeking reliable returns, looking to add a bit more risk to your portfolio or are new to investing, MoneyWeek asked the experts for funds and investment trusts you could consider in 2026
-
 The most popular fund sectors of 2025 as investor outflows continue
It was another difficult year for fund inflows but there are signs that investors are returning to the financial markets