My two main target levels for the Dow
The Dow Jones's recent rally may have fooled some people into believing the bull market was back on. But John C Burford doesn't think so, and turns to the charts for a low-risk short entry.
Get the latest financial news, insights and expert analysis from our award-winning MoneyWeek team, to help you understand what really matters when it comes to your finances.
You are now subscribed
Your newsletter sign-up was successful
Want to add more newsletters?

Twice daily
MoneyWeek
Get the latest financial news, insights and expert analysis from our award-winning MoneyWeek team, to help you understand what really matters when it comes to your finances.

Four times a week
Look After My Bills
Sign up to our free money-saving newsletter, filled with the latest news and expert advice to help you find the best tips and deals for managing your bills. Start saving today!
When I wrote about the Dow last Monday, it had made a sharp move up in a classic short squeeze. And since then, the charts have given me the green light to get back on the short side. I'll tell you more on that in a moment.
First, an observation I wonder if you've noticed the same thing?
In recent months, it's been a striking feature of the bear market rallies we've seen that upward corrections have generally been very steep. And that has meant they've fooled many into believing that the old bull market had been switched back on.
MoneyWeek
Subscribe to MoneyWeek today and get your first six magazine issues absolutely FREE

Sign up to Money Morning
Don't miss the latest investment and personal finances news, market analysis, plus money-saving tips with our free twice-daily newsletter
Don't miss the latest investment and personal finances news, market analysis, plus money-saving tips with our free twice-daily newsletter
Here's what I think has been going on...
What's driving the bull market rallies
Many investors have believed that European leaders would eventually solve' their eurozone problems and that would get the world economies back on track. After all, interest rates are on the floor and there is plenty of new money available for investment and Western companies are loaded with cash.
Well, as you'll know if you've been reading MoneyWeek Trader for a while, I have a different view. It has been my strong belief that the rally would peter out.
Last week, I wondered if the rally to the 12,920 level on 2 July had done its work of squeezing out enough weak shorts to allow for the top to be put in place.
So my question was where to place a low-risk short entry?
I decided to watch developments over the next period to see if any decent tramlines would pop up.
Trader tip: When I look for a top in a bear market rally, I will search for a relevant Fibonacci retrace level, or more likely, a reliable set of tramlines on a short-term chart usually a 15-minute. If I can also spot a weakening momentum as prices rise towards my candidate for the top, that is the icing on the cake!
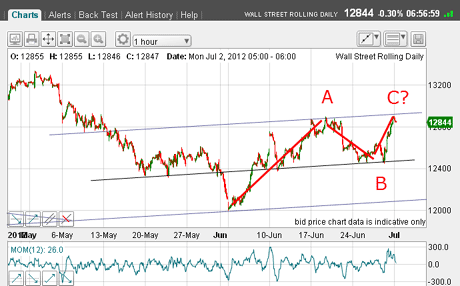
So this was the situation last Monday:
(Click on the chart for a larger version)
The market had rallied to my upper tramline and was potentially making the C wave top.
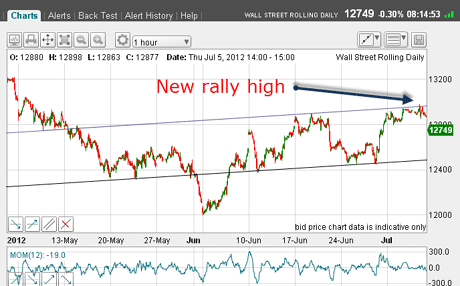
But, of course, we must always allow for the market to spend more time in this region and perhaps extend the rally a little. After all, the market had just popped above the A wave top. There were sure to be many protective buy-stops placed there by the late-coming shorts who were shorting during the B wave dip.
And that's exactly what occurred. On Thursday, the market took out even more buy-stops and poked up to the 12,980 level. Take a look here:
(Click on the chart for a larger version)
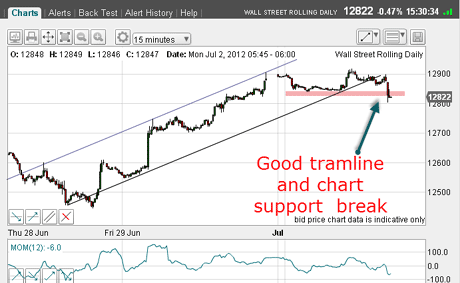
Was this the top? I had to go to my short-term charts for clues and this is what I found:
(Click on the chart for a larger version)
Good tramlines found on 15-minute chart
I found some good tramlines on the 15-minute chart, with several touch-points and there was a potential break of the lower tramline onThursday.
And with the break of chart support (pink bar), I had a short trade!
As always, my 3% protective stop was placed just above the recent high for a low-risk entry. Nice.
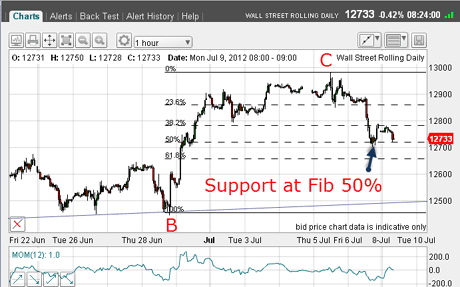
As you can see from the hourly chart from this morning, the market broke on Friday, and found some support late in the day at the Fibonacci 50% retrace of the C wave:
(Click on the chart for a larger version)
OK, so far, so good. Do I have a target for this trade?
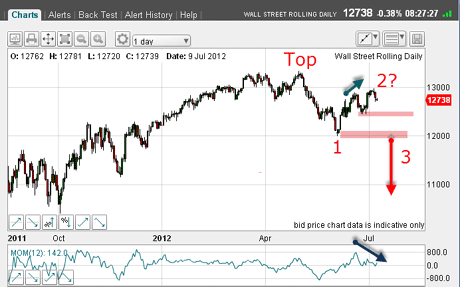
Here is the daily chart again:
(Click on the chart for a larger version)
If my Elliott wavelabels are correct, we have seen the 2 wave top at 12,980 and have started a very large 3 wave down.
Note the severe negative momentum divergence at the C wave top (green arrows), which has reinforced my immediate bearish view.
I am using the two pink bars as my main targets these are the previous major lows at the 12,450 and 12,000 levels.
A rapid descent to the first would confirm we are in a third wave. That lies 300 pips away.
Trader tip: Needless to say, I love third waves! They are usually long and strong' and continue much farther than many expect and they are a shock to the majority. They are brutal to those on the wrong side and take no prisoners. Try to locate them on your charts it is well worth the effort.
Investor sentiment reinforces my view
At this point, I like to take a look at the latest sentiment readings and here is the AAII survey for the week ending 4 July:
| Bullish | 33% | 4% | 39 |
| Bearish | 33% | -11% | 30 |
| Neutral | 34% | 7% | 31 |
There has been a 15% swing to the bullish camp at the same time as the market was rallying hard in the C wave.
This, once again, illustrates that the public and most professionals clamber on board bear market rallies right near the top. It's uncanny how this plays out in front of your eyes time and time again that's herding for you!
Luckily for me, that is the reason I'm presented with great counter-trades so often. That can happen for you, too.
Trader tip: Sadly, sentiment data is usually quite aged before it gets released and is of little use in the kind of short-term market timing that I practise. But it does help reinforce my entry decisions, once made. It is of more immediate use in the medium-term say on the daily charts.
So now I have a roadmap for the Dow let's see how it plays out.
That's all today. If you have any thoughts or comments, share them below.
If you're a new reader, or need a reminder about some of the methods I refer to in my trades, then do have a look at my introductory videos:
The essentials of tramline trading
An introduction to Elliott wave theory
Advanced trading with Elliott waves
Don't miss my next trading insight. To receive all my spread betting blog posts by email, as soon as I've written them, just sign up here .
Get the latest financial news, insights and expert analysis from our award-winning MoneyWeek team, to help you understand what really matters when it comes to your finances.
John is is a British-born lapsed PhD physicist, who previously worked for Nasa on the Mars exploration team. He is a former commodity trading advisor with the US Commodities Futures Trading Commission, and worked in a boutique futures house in California in the 1980s.
He was a partner in one of the first futures newsletter advisory services, based in Washington DC, specialising in pork bellies and currencies. John is primarily a chart-reading trader, having cut his trading teeth in the days before PCs.
As well as his work in the financial world, he has launched, run and sold several 'real' businesses producing 'real' products.
-
 ISA fund and trust picks for every type of investor – which could work for you?
Whether you’re an ISA investor seeking reliable returns, looking to add a bit more risk to your portfolio or are new to investing, MoneyWeek asked the experts for funds and investment trusts you could consider in 2026
-
 The most popular fund sectors of 2025 as investor outflows continue
It was another difficult year for fund inflows but there are signs that investors are returning to the financial markets