This could be a crucial level for the Dow
The rally in the Dow has run up against a rock-solid level of resistance, says John C Burford. Can the market power through? Or is it only down from here?
Get the latest financial news, insights and expert analysis from our award-winning MoneyWeek team, to help you understand what really matters when it comes to your finances.
You are now subscribed
Your newsletter sign-up was successful
Want to add more newsletters?

Twice daily
MoneyWeek
Get the latest financial news, insights and expert analysis from our award-winning MoneyWeek team, to help you understand what really matters when it comes to your finances.

Four times a week
Look After My Bills
Sign up to our free money-saving newsletter, filled with the latest news and expert advice to help you find the best tips and deals for managing your bills. Start saving today!
I'm back from my short break away from the markets. Did I miss much?
You could say so! No sooner had I closed down my screens than the markets embarked on huge short-covering rallies.
It's a good job I decided to cover my short positions on Wednesday. That seemed like the smart thing to do. After all, expectations were generally very low for anything even mildly constructive to emerge from the latest eurozone crisis summit. To a contrarian like me, that meant there was a decent chance for a surprise.
MoneyWeek
Subscribe to MoneyWeek today and get your first six magazine issues absolutely FREE

Sign up to Money Morning
Don't miss the latest investment and personal finances news, market analysis, plus money-saving tips with our free twice-daily newsletter
Don't miss the latest investment and personal finances news, market analysis, plus money-saving tips with our free twice-daily newsletter
But I confess the magnitudes of the rallies were far stronger than I imagined. The Dow was up 250 pips, gold rallied almost $50, and the EUR/USD gained around 200 pips.
That was some short squeeze!
But the big question is: has it done its work? Has this rally set up another shorting opportunity? Let's take a look.
My Elliott wave road map was wrong
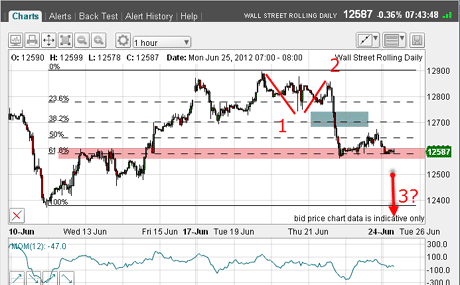
When I last wrote about the Dow a week ago, this was the situation:

(Click on the chart for a larger version)
I had pencilled in a sharp decline in a third wave, and this is what I wrote then:
You can see how the market stalled at the Fibonacci 62% retrace of the rally with a small bounce on Friday. That's to be expected at this important Fibonacci level.
But if we are in a genuine third wave, rallies should be brief before new lows are plumbed.
That's one of the great benefits of using Elliott wave principles. It gives you a definite roadmap ahead based on your suggested wave count.
I have projected a heavy decline based on what third waves look like. But if the market suddenly reverses and rallies strongly, then I know my wave labels are wrong, and I will likely abandon my trade.
And since the market did rally strongly off a lower low, I did abandon my trade and my Elliott roadmap was clearly wrong. That's OK it's part of trading. So I keep on looking for clues as to where the market could be heading next.
I've found a great set of short-term tramlines
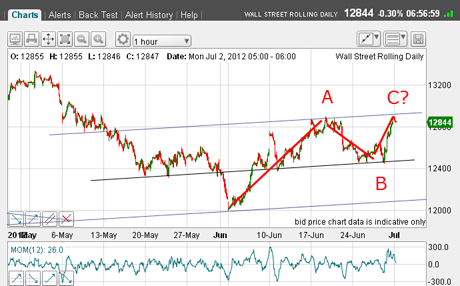
Last Monday, I asked if anyone could spot any short-term tramlines and this morning, I can see a beautiful trio on the hourly chart:

(Click on the chart for a larger version)
The central tramline was drawn before Thursday and contains several good touch-points. The upper line has a nice prior pivot point(PPP) and passes across the highs of the A wave top
But look at where Friday's rally carried to right to the upper tramline. And it's bouncing down off it as I write just as it should!
Incidentally, my lowest tramline passes right through the 4 June plunge low.
And I now have a new A-B-C pattern. Remember, these are corrective to the main trend (down).
How much confidence can I have in these tramlines? After all, they cover only a relatively short period.
Trader tip: When I draw short-term tramlines, I like to go back in time and extend the lines to see if they intersect important highs and lows in previous periods. If they do, I can have greater confidence in my short-term placements.
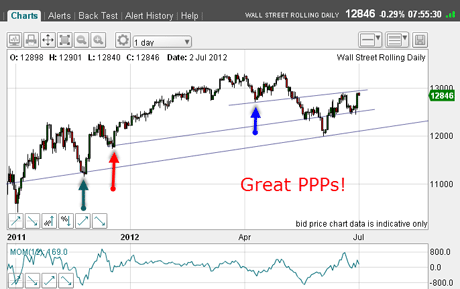
And this is what I find on the daily chart:

(Click on the chart for a larger version)
Just admire the PPPs shown by my coloured arrows! To me, that is impressive, with the earliest (green arrow) set last year.
These tramlines are evidently well-anchored, and represent lines of strong support and resistance. Breaking through any of them will require considerable push. So on the face of it, attempts to break them would likely be repelled.
As you can see, the market is attempting to do just that at the upper tramline. Will the line hold, or will it break?
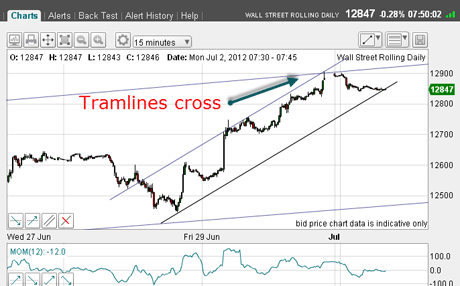
To search for clues, let's look at the 15-minute chart:

(Click on the chart for a larger version)
I have drawn a tentative short-term tramline pair with the market challenging the lower line. My upper tramline looks good with a nice PPP and three or so touch-points.
Waiting for confirmation that the top is in
My take here is that the market should bounce up off the lower line. The question is, will it reach my long-term tramline in the 12,920 area? That is only 60 pips away.
But with my A-B-C pattern in place and the strong resistance at my long-term tramline, the odds do favour a top in this region before the bear market resumes.
And a break of my lower tramline would be dangerous for the bulls and help confirm the top is in.
By the way, it's worth noting that action this week should be a little more subdued with the 4 July US holiday mid-week.
If you're a new reader, or need a reminder about some of the methods I refer to in my trades, then do have a look at my introductory videos:
The essentials of tramline trading
An introduction to Elliott wave theory
Advanced trading with Elliott waves
Don't miss my next trading insight. To receive all my spread betting blog posts by email, as soon as I've written them, just sign up here .
Get the latest financial news, insights and expert analysis from our award-winning MoneyWeek team, to help you understand what really matters when it comes to your finances.
John is is a British-born lapsed PhD physicist, who previously worked for Nasa on the Mars exploration team. He is a former commodity trading advisor with the US Commodities Futures Trading Commission, and worked in a boutique futures house in California in the 1980s.
He was a partner in one of the first futures newsletter advisory services, based in Washington DC, specialising in pork bellies and currencies. John is primarily a chart-reading trader, having cut his trading teeth in the days before PCs.
As well as his work in the financial world, he has launched, run and sold several 'real' businesses producing 'real' products.
-
 MoneyWeek Talks: The funds to choose in 2026
Podcast Fidelity's Tom Stevenson reveals his top three funds for 2026 for your ISA or self-invested personal pension
-
 Three companies with deep economic moats to buy now
Opinion An economic moat can underpin a company's future returns. Here, Imran Sattar, portfolio manager at Edinburgh Investment Trust, selects three stocks to buy now