Another classic pattern emerges in the Dow
After the Dow Jones's textbook 400-point rally, John C Burford identifies another classic pattern, and lkooks to where the market is going next.
Get the latest financial news, insights and expert analysis from our award-winning MoneyWeek team, to help you understand what really matters when it comes to your finances.
You are now subscribed
Your newsletter sign-up was successful
Want to add more newsletters?

Twice daily
MoneyWeek
Get the latest financial news, insights and expert analysis from our award-winning MoneyWeek team, to help you understand what really matters when it comes to your finances.

Four times a week
Look After My Bills
Sign up to our free money-saving newsletter, filled with the latest news and expert advice to help you find the best tips and deals for managing your bills. Start saving today!
If you read these articles regularly, you'll know I've been very closely following the action in the Dow lately. In fact, all four articles this week (including this one) have been about the Dow, and I make no apologies for this.
It's not the only market I like to trade. I trade gold and the euro, too, as well as other markets.
But, right now, it's the Dow that's presenting us with some stunning examples of how you can trade using my trading methods.
MoneyWeek
Subscribe to MoneyWeek today and get your first six magazine issues absolutely FREE

Sign up to Money Morning
Don't miss the latest investment and personal finances news, market analysis, plus money-saving tips with our free twice-daily newsletter
Don't miss the latest investment and personal finances news, market analysis, plus money-saving tips with our free twice-daily newsletter
Remember, my articles are not trading recommendations. They're a real-time commentary on how I use my trading methods to make profits in these tough markets.
So let me bring you up to date with how I've been trading this week
The real reason for the Dow's 400-point rally
Make no mistake many traders are scratching their heads over the rollercoaster rides in the Dow with swings of 500 pips in rapid succession. I hope to show how you can trade these volatile markets using my time-tested methods.
On Wednesday, the market had come within pips of hitting my long-standing target at 12,500.
And yesterday, the Dow took off like a rocket and is currently trading at over 12,900 a tremendous move of over 400 pips in just a few hours.
Now, if you read and believe the mainstream's rationale behind this move, let me offer you an alternative explanation. It has little to do with the news'.
The conventional story was Mario Draghi's announcement "that the ECB stood ready to do whatever it takes' to retain the euro". There were also some positive earnings reports out of the US (a lagging data point).
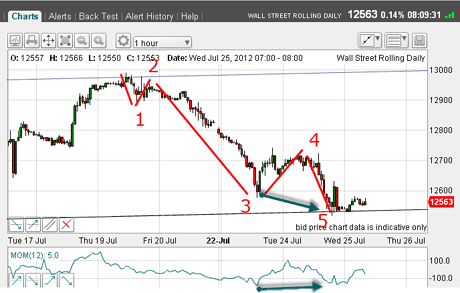
But remember on Wednesday, I noted that the market had completed a textbook five waves down to the 12,500 level on Tuesday many hours before the above news emerged.
I stated then that I expected a rally from this level, and this is what occurred.
So in a nutshell, my explanation of the rally is this: a completed five waves down and a counter-trend rally lies ahead and I forecast it, unlike the news junkies.
In other words, the news' followed the market!
But most believe the very opposite and this is one of the many market myths that I aim to bust in these articles. Keep reading them
An essential point to understand about markets
If you are, or would like to be, a serious trader, you need to understand that markets are patterned and the patterns are virtually independent of the news flow.
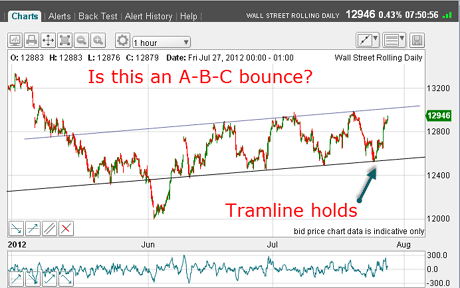
Now this morning, the market is moving up towards my upper major tramline. The question is: will it make it? Let's get to the charts

(Click on the chart for a larger version)
As I stated, I am looking for an A-B-C formto the rally, but gazing at the hourly chart, I'm squinting hard, and can make one out more on this later.
But on Wednesday, before the huge rally, I had stated that short-term traders were taking profits near the lower tramline for gains of around 400 pips. Longer-term traders would be holding, but placing protect-profit stops just above the wave 4 high (around 12,750):

(Click on the chart for a larger version)
I'll tell you the reason for this area being a sensible place to put buy-stop orders
The strong signal that the market was turning
After a five-wave down move, rallies often turn in the region of the previous fourth-wave top. Any move beyond this normally means a more significant rally is in the works as it proved yesterday.
Longer-term traders, having shorted near the 12,900 level on 19 July and exited in the 12,750 area yesterday, still netted a good profit of 150 pips or so.
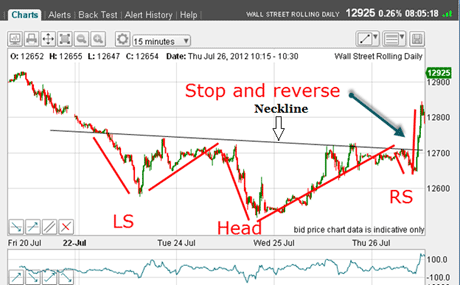
And with the very strong kick off the lower tramline, many traders would have been very tempted to reverse positions and go long. Especially when presented with this chart:

(Click on the chart for a larger version)
On the 15-minute chart, I can make out a very clear reverse 'head and shoulders'pattern. And when the market broke above the neckline, that was the place to act.
So I'm now long at 12,750. The big question is: Where is the likely top to this rally?
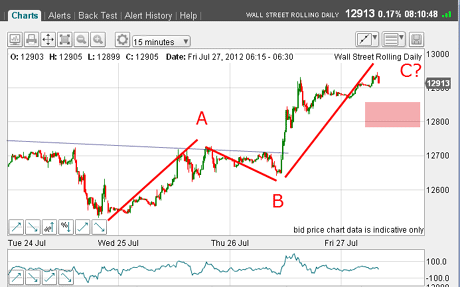
Let's zoom in on the 15-minute chart:

(Click on the chart for a larger version)
Now I can see a possible A-B-C form. And note the current wave up is starting to lose momentum a potentially bearish sign.
If the market does top here before hitting my upper major tramline in the 13,000 area, the pink zone would be a danger area for bulls.
Sentiment swings to bullish
So how do the sentiment figures stack up this week? Recall, last week saw a massive swing to the bearish camp which provided the fuel for the huge rallies.
Here is the latest AAII data as of 25 July:
| Week ending 7/25 | 28% | 43% | 29% |
| Change in week | 6% | 1% | -7% |
| Long-term average | 39% | 30% | 31% |
So last week, there was a modest 5% swing to the bullish camp. Aren't these people fickle? And this bullish bias came despite the 500-pip decline that week, as investors bought the dips.
So my strategy is this: I have my protect-profit sell stops on my longs in the pink zone, and if the market does decide to extend its pop', will look to exit on any move into the 13,000 area.
I will also look to re-establish short positions, looking for a resumption of the bigger bear market.
And remember, the news follows the markets. So don't get hung up on trading off it as you will likely be zigging when you should be zagging.
Do let me know your thoughts on the Dow and I will try to get to the euro and gold next week! Leave a comment below.
If you're a new reader, or need a reminder about some of the methods I refer to in my trades, then do have a look at my introductory videos:
The essentials of tramline trading
An introduction to Elliott wave theory
Advanced trading with Elliott waves
Don't miss my next trading insight. To receive all my spread betting blog posts by email, as soon as I've written them, just sign up here . If you have any queries regarding MoneyWeek Trader, please contact us here .
Get the latest financial news, insights and expert analysis from our award-winning MoneyWeek team, to help you understand what really matters when it comes to your finances.
John is is a British-born lapsed PhD physicist, who previously worked for Nasa on the Mars exploration team. He is a former commodity trading advisor with the US Commodities Futures Trading Commission, and worked in a boutique futures house in California in the 1980s.
He was a partner in one of the first futures newsletter advisory services, based in Washington DC, specialising in pork bellies and currencies. John is primarily a chart-reading trader, having cut his trading teeth in the days before PCs.
As well as his work in the financial world, he has launched, run and sold several 'real' businesses producing 'real' products.
-
 Average UK house price reaches £300,000 for first time, Halifax says
While the average house price has topped £300k, regional disparities still remain, Halifax finds.
-
 Barings Emerging Europe trust bounces back from Russia woes
Barings Emerging Europe trust has added the Middle East and Africa to its mandate, delivering a strong recovery, says Max King