Bull’s eye!
The gold price has so far followed the script to the letter. But which way will it go now? John C Burford uses his money management rules to make a low-risk trade.
Get the latest financial news, insights and expert analysis from our award-winning MoneyWeek team, to help you understand what really matters when it comes to your finances.
You are now subscribed
Your newsletter sign-up was successful
Want to add more newsletters?

Twice daily
MoneyWeek
Get the latest financial news, insights and expert analysis from our award-winning MoneyWeek team, to help you understand what really matters when it comes to your finances.

Four times a week
Look After My Bills
Sign up to our free money-saving newsletter, filled with the latest news and expert advice to help you find the best tips and deals for managing your bills. Start saving today!
Today I would like to cover gold as it is displaying some terrific tramlines and Fibonacci moves that have pointed to several excellent low-risk trade entries.
Remember, my posts are primarily intended to give examples in real time in real market situations which you can transfer to the trading of your own markets. Apply my methods and money management rules in a similar way, and who knows what results you will have!
When I left gold last Wednesday, I made a good case for a rally early in the New Year.
MoneyWeek
Subscribe to MoneyWeek today and get your first six magazine issues absolutely FREE

Sign up to Money Morning
Don't miss the latest investment and personal finances news, market analysis, plus money-saving tips with our free twice-daily newsletter
Don't miss the latest investment and personal finances news, market analysis, plus money-saving tips with our free twice-daily newsletter
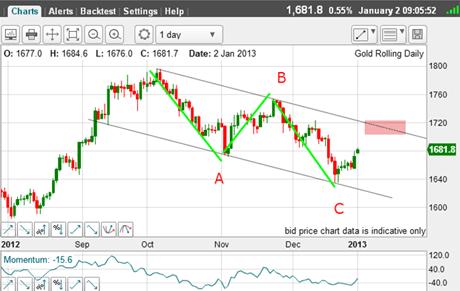
However, I could not see a trade at that time.See the below chart for the picture then.
The market had bounced off my lower tramline at the C wave low.But unless you had been nimble enough to go long near $1,640 and I wasn't it was too late to enter at low risk.
(Click on the chart for a larger version)
When trading off tramlines, it is essential to make your entry as close as possible to the tramline so as to reduce your risk. An entry near Wednesday's market at $1,680 would necessitate a stop of $40 or greater.For swing trading, this is far too large.
That is why I stayed on the sidelines last week.
My expected rally was in progress and I had a potential target in the $1,700 area.
A direct hit!
So let's fast forward to Thursday:
(Click on the chart for a larger version)
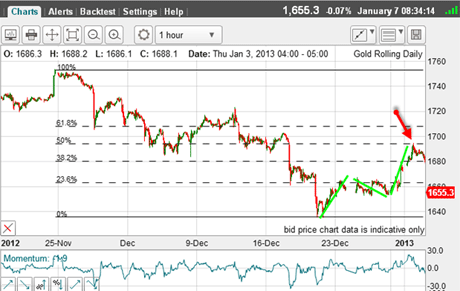
My rally carried to $1,695 (red arrow), but then hit a brick wall right at the precise Fibonacci 50% retrace of the decline off the important 25 November high at $1,750.The rally had missed my target by only $5.
But that was one magnificent direct hit on a Fibonacci level.
In addition, the rally off the $1,635 low was a clear A-B-C (green bars).
This was a clue that the rally wasprobably over.
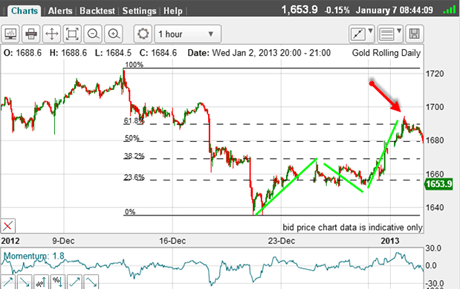
Also, when looking at Fibonacci retracements, it is a good idea to discover the levels from a different pivot point from another significant high.Here are the Fibonacci levels using the 12 December high:
(Click on the chart for a larger version)
Here, the rally has carried to the Fibonacci 62% retrace with a slight overshoot.
So we have two points of resistance at Fibonacci levels derived from two different high pivot points.
Putting this together with the A-B-C rally form, I now have a good case for the market to decline.
A good trade entry would be short near the $1,690 level with a protective stop at the $1,700 area.
Let's see where we are this morning:
(Click on the chart for a larger version)
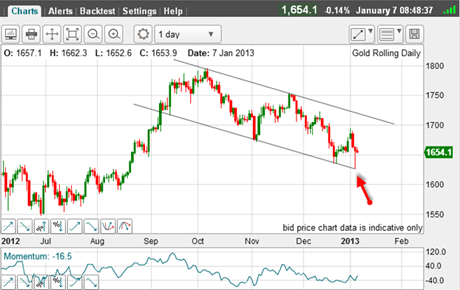
Indeed, the market did fall back last week and hit my lower tramline on Friday (red arrow) the tramline I had drawn days previously.
So, in addition to the Fibonacci hits, here is a superb tramline hit. That was very pretty.
Again, a very nimble trader would be looking to cover any shorts there and also go long in anticipation of a tramline bounce.
But now the question is this: which way now?
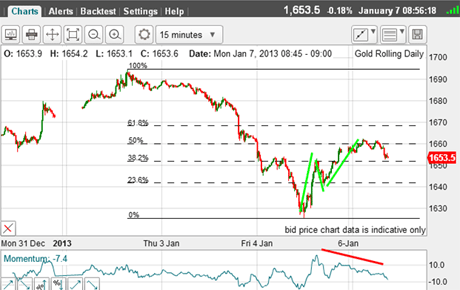
Well, let's take a look at the short-term picture:
(Click on the chart for a larger version)
Right away, the bounce has carried to the Fibonacci 50% retrace of the decline off Wednesday's $1,695 high.And the rally has a distinct A-B-C form (green bars).
In addition, there is a marked negative momentum divergence between the A and C wave tops (red bar).
This set-up is near perfect: be short in the $1,660 area using a close stop within the 3% risk limit.
Now if the market declines from here, we can set targets depending on the form of the decline.We can also lower our stop to break-even when conditions are favourable.
And if the market rallies from here, we have our stop in place to limit our loss.
So in the space of a few days, we have several possible low-risk trades, both on the long and short sides of the market.All the while, the market is this morning unchanged from where it was just before Christmas!
Of course, this type of quick-fire swing trading is not attractive to some traders, especially those who prefer to hold for the long pull.
But for active traders who have the time (and inclination) to be close to the markets, it is possible to rack up major profits in relatively short time spans.
If you're a new reader, or need a reminder about some of the methods I refer to in my trades, then do have a look at my introductory videos:
The essentials of tramline trading
An introduction to Elliott wave theory
Advanced trading with Elliott waves
Don't miss my next trading insight. To receive all my spread betting blog posts by email, as soon as I've written them, just sign up here . If you have any queries regarding MoneyWeek Trader, please contact us here.
Get the latest financial news, insights and expert analysis from our award-winning MoneyWeek team, to help you understand what really matters when it comes to your finances.
John is is a British-born lapsed PhD physicist, who previously worked for Nasa on the Mars exploration team. He is a former commodity trading advisor with the US Commodities Futures Trading Commission, and worked in a boutique futures house in California in the 1980s.
He was a partner in one of the first futures newsletter advisory services, based in Washington DC, specialising in pork bellies and currencies. John is primarily a chart-reading trader, having cut his trading teeth in the days before PCs.
As well as his work in the financial world, he has launched, run and sold several 'real' businesses producing 'real' products.
-
 Should you buy an active ETF?
ETFs are often mischaracterised as passive products, but they can be a convenient way to add active management to your portfolio
-
 Power up your pension before 5 April – easy ways to save before the tax year end
With the end of the tax year looming, pension savers currently have a window to review and maximise what’s going into their retirement funds – we look at how