There could be a big move coming on the Dow
With politicians desperate to save the world, volatility is set to increase in the markets this week. Traders must tread carefully, says John C Burford, and practise strict money management.
Get the latest financial news, insights and expert analysis from our award-winning MoneyWeek team, to help you understand what really matters when it comes to your finances.
You are now subscribed
Your newsletter sign-up was successful
Want to add more newsletters?

Twice daily
MoneyWeek
Get the latest financial news, insights and expert analysis from our award-winning MoneyWeek team, to help you understand what really matters when it comes to your finances.

Four times a week
Look After My Bills
Sign up to our free money-saving newsletter, filled with the latest news and expert advice to help you find the best tips and deals for managing your bills. Start saving today!
So what do you think is the Dow about to rally further?
That might seem an odd question to ask after a 600-pip rally this past week or so! But then many are expecting another round of quantitative easing to fire up the market.
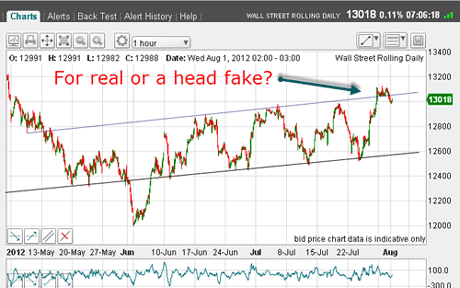
As you may have noticed if you've been following the tramline set I've had in place for a few months, there has been an upward break above the upper tramline on the hourly chart.
MoneyWeek
Subscribe to MoneyWeek today and get your first six magazine issues absolutely FREE

Sign up to Money Morning
Don't miss the latest investment and personal finances news, market analysis, plus money-saving tips with our free twice-daily newsletter
Don't miss the latest investment and personal finances news, market analysis, plus money-saving tips with our free twice-daily newsletter
You can see it in the chart below.
Of course, this would normally signify a bull run lies ahead as the next target would be a higher tramline. It would be time to get long.
(Click on the chart for a larger version)
But, as with all things in life, we must look at context.
Is this a real break or a fake?
What I mean is that we need to consider the context of this tramline break. Remember: It could possibly be a head fake', of which I have shown many examples over these past months.
Recall from my previous Dow coverage that I believe much of the sharpness of the recent rally has been due to a massive short squeeze put on to the late-coming bears who have been seduced by the overly gloom-and-doom sentiment that has prevailed.
And not only has the US public been very bearish as evidenced by the AAII data but the mainstream press has also been in a funk with very few bullish articles in the sources I read.
This has created the ideal scenario for this snap-back rally. But to put the Dow rally into perspective, I want to show you another stock index which is more representative of the market as a whole the S&P 500.
How the S&P compares to the Dow
Remember, the Dow Jones Industrials index, which I trade, contains the 30 largest cap stocks on the NYSE board these are the household names and are generally good solid dividend-payers.
When risk is 'off', investors flock to these shares in preference to the perceived riskier smaller cap shares, such as contained in the S&P 500, where dividends are more uncertain.
So let's look at the S&P now to see if there are any differences with the Dow in the current rally:
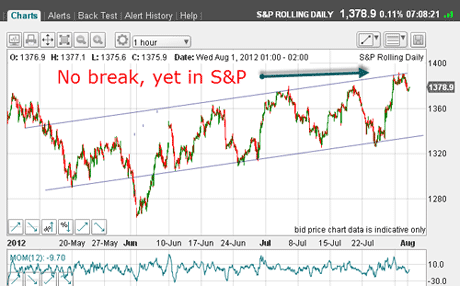
(Click on the chart for a larger version)
And guess what? The equivalent tramline pair is shown and there has not yet been a break, although the market has touched the upper one. Naturally, we cannot expect the touch-points to be lined up perfectly on tramlines, and we must employ a certain amount of dodging' to get the best fit.
But I believe with the good prior pivot point (PPP) to the left of the chart I have a decent pair. And so far, the tramline has held. The normal trade here would be a short, of course, as the market bounces off the upper tramline.
Incidentally, the S&P is the most heavily traded US stock index, especially its incarnation as the e-mini S&P the day-trader's favourite.
The other major US stock index is the Nasdaq. This is considered even farther along the risk scale, as many components are in the tech and biotech sectors and are definitely not household names.
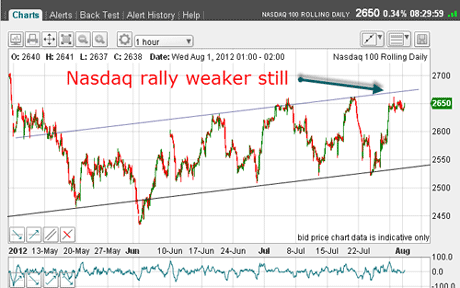
If we are truly in a risk-off environment, I would expect the rally in the Nasdaq to be weaker than in the S&P and the Dow. And that is what we find:
(Click on the chart for a larger version)
See how the upper tramline has not been hit, indicating a lesser preference for risky shares.
To sum up: the rally off the lower tramline a week or so ago is stronger in the Dow, then weaker in the S&P and then weaker still in the Nasdaq. This tells me something mainly that I should be suspicious of the Dow's poke above its tramline in other words that it could well be a head fake.
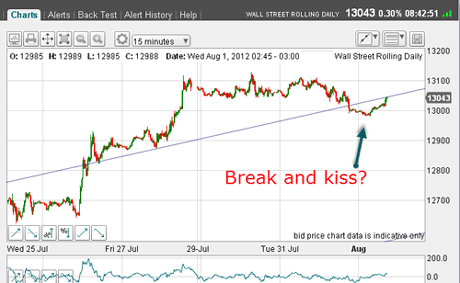
So let's take a closer look. Here is the 15-minute Dow chart:
(Click on the chart for a larger version)
We have last Thursday's upward break and since then, I can see the move to the 13,100 area is accompanied by a possible negative momentum divergence. Then yesterday, the market broke back down below the tramline; and this morning, it is kissing the underside of the line.
Is this a great place to short?
With the above evidence of the weakness of the other indexes, and the form of last week's action above the tramline, an aggressive trader would think so! And a sensible place for a protective stop is just above the 13,100 level for a 50-80 pip risk.
And if we suppose that the 13,100 level will hold, then can I find a different tramline set to describe long-term trading? Here is the daily chart:
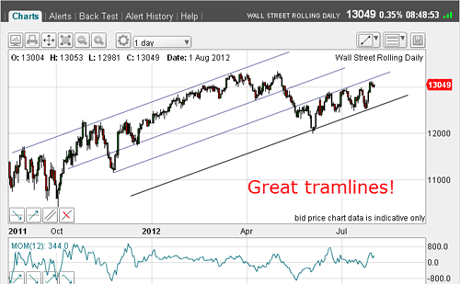
(Click on the chart for a larger version)
And just look at the terrific touch-points going back almost a year! To me, these are very convincing and notice that the current rally has not even touched my newly-drawn tramline (second one up).
So maybe my old set is dying out and I should be getting ready to kiss it goodbye.
Trader tip: When tramline trading, we all have the same problems how much do I rely on my existing tramlines, especially when they have worked so well, as these have? And when should I look for new ones? There is no easy answer.
But one of the great benefits of tramline trading is that we can find sensible low-risk trades that have a high probability of success. We can locate good stop-loss positions and that is one of the many topics you learn in my next MoneyWeek Trader workshop. (We're still finalising venue details, but should be ready very soon.)
Let's see what the central bankers do!
As you probably know, there are more than the usual number of important events looming, with meetings from the Fed to the eurozone. Politicians in true King Canute mode are desperate to save the world!
That means volatility is set to increase this week and there is a real possibility that we shall see a burst of buying, followed by huge selling in a spike.
If so, this would take out many shorts (again). It should be a great spectacle and we need to trade carefully, using strict money management and discipline. Let's see how it pans out
Do you have a view on the market bigger rally or bigger sell-off? Share your thoughts here.
If you're a new reader, or need a reminder about some of the methods I refer to in my trades, then do have a look at my introductory videos:
The essentials of tramline trading
An introduction to Elliott wave theory
Advanced trading with Elliott waves
Don't miss my next trading insight. To receive all my spread betting blog posts by email, as soon as I've written them, just sign up here . If you have any queries regarding MoneyWeek Trader, please contact us here.
Get the latest financial news, insights and expert analysis from our award-winning MoneyWeek team, to help you understand what really matters when it comes to your finances.
John is is a British-born lapsed PhD physicist, who previously worked for Nasa on the Mars exploration team. He is a former commodity trading advisor with the US Commodities Futures Trading Commission, and worked in a boutique futures house in California in the 1980s.
He was a partner in one of the first futures newsletter advisory services, based in Washington DC, specialising in pork bellies and currencies. John is primarily a chart-reading trader, having cut his trading teeth in the days before PCs.
As well as his work in the financial world, he has launched, run and sold several 'real' businesses producing 'real' products.
-
 Pitch to Portfolio: Lioness Jill Scott's investing game plan
Podcast After bringing football home as a Lioness, Jill Scott discusses how she transformed her finances and became an investor in this latest episode of MoneyWeek Talks.
-
 UK unemployment hits highest level since 2021 – will interest rate cuts follow?
UK unemployment reached its highest rate in almost five years by the end of 2025. Is AI to blame and will the Bank of England step in with an interest rate cut in March?